
The low end of Intuitive Surgical’s five-year P/E range is 57.2. Today the stock trades at 43.8. So in the period our database covers, the shares have never been as cheap on earnings as they are this week, and they are still at 45.1 times trailing profit, a multiple most industrial and medical-device buyers would not touch.
That is the tension behind the title. Intuitive has never been cheap by any value screen, and I do not expect a screen to change that. The stock closed at $393 on 2026-09-18, 34.9% below its 52-week high of $604. The question is whether the fall came from the business or from the multiple, because the two call for opposite responses.
One view up front. The business did not break, the multiple did what a multiple at 70 times earnings eventually does, and the price that remains is still a growth-stock price. The rest of this note is the evidence for that, and the one place where I think a skeptic has a fair point.
What the income statement says
Start with the financials tab. Revenue went from $4.4 billion in fiscal 2020 to $10.1 billion in 2025, a compound rate of about 18% a year. The path was not smooth. Fiscal 2020 fell 3% in the pandemic and 2021 jumped 31% on the reopening of elective surgery. Since then growth has stepped up from 14% to 17% to 21%. Growth has been speeding up on a base that is now more than twice as large as five years ago, which is the reverse of what usually happens to a large company.
Operating income tells the same story with a wobble in the middle. It went from $1.05 billion in 2020 to $1.82 billion in 2021 and slid to $1.58 billion in 2022. By 2025 it had reached $2.9 billion. The table below has the EBIT margin by year, from 24.1% in 2020 to 29.3% now. I would not call 2021 the norm. It was a reopening year with unusually full operating rooms, and the company has spent the years since building back to something close to it. A margin of 29.3% on $10.1 billion of revenue is roughly a dollar in operating profit for every $3.40 of sales.
| Fiscal year | Revenue ($B) | Revenue growth | EBIT margin | Diluted EPS ($) |
|---|---|---|---|---|
| 2020 | 4.36 | -3% | 24.1% | 2.94 |
| 2021 | 5.71 | 31% | 31.9% | 4.66 |
| 2022 | 6.22 | 9% | 25.3% | 3.65 |
| 2023 | 7.12 | 14% | 24.8% | 5.03 |
| 2024 | 8.35 | 17% | 28.1% | 6.42 |
| 2025 | 10.06 | 21% | 29.3% | 7.87 |
Diluted EPS went from $2.94 to $7.87 over the period. Note the 22% drop in 2022, the same year revenue rose 9%. Costs caught up before pricing and volumes did. Remember that when the margin slips again.
Where the money is made
Roughly three-quarters of revenue does not depend on a new robot being sold. In the June quarter, instruments and accessories brought in $1.73 billion, or 60% of the total. Systems added $685 million and service $472 million. Instruments plus service, the part that arrives every time a surgeon uses an installed machine, came to 76% of the quarter.
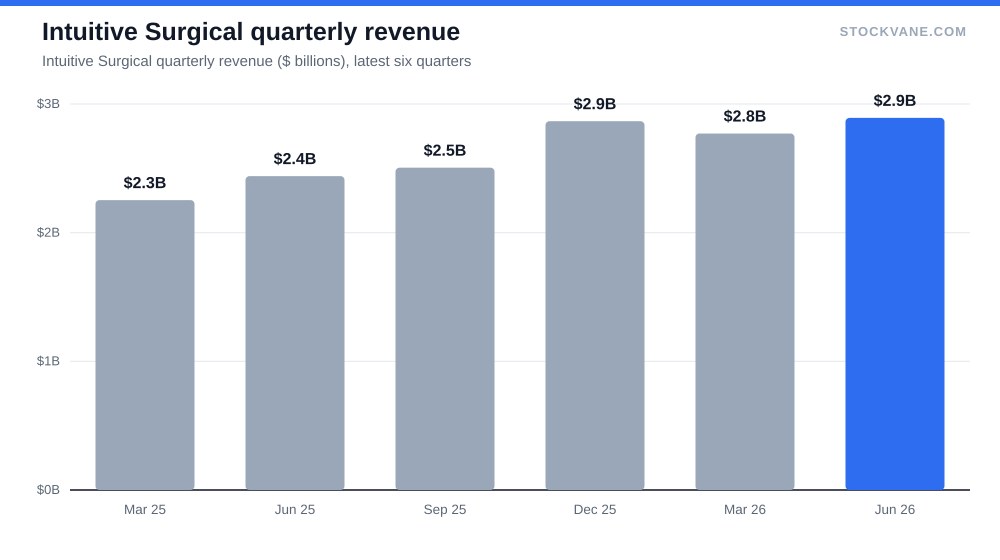
I find that split more useful than any growth rate. A hospital that buys a system has committed to a stream of disposable parts for years. Systems revenue is lumpy, because it follows hospital budgets, while instruments follow procedures, which follow the ageing of the population and the surgeon’s habit. The latest quarter’s revenue was $2.9 billion, up 19% from a year earlier and 4% above the March quarter. Multiply the quarter by four and you get $11.6 billion, which is 15% above fiscal 2025, so the run rate has not slowed.
Why the stock fell anyway
Here is the awkward part. On July 16 the company reported the June quarter and the shares dropped -14.1% in a day. The average earnings-day move over the last four reports is 8.9%, so the drop was larger than usual, in a stock that had moved +13.9%, -0.3% and +7.2% on the three reports before it. I will not guess at what the traders were reacting to, since nothing in the database explains the day. What I can say is what the numbers looked like afterwards.
Gross margin was 66.0% for 2025, against 67.5% the year before. That is a slip of 1.5 points while revenue grew 21%. It is the single figure I would put in front of a skeptic, because a razor-and-blade company that is selling more razors should not be losing margin. Mix is one candidate, since systems carry lower margins than instruments. Costs are another. I do not know which, and the data I have does not separate them.
That gap in the data matters, and I would not paper over it.
Then the multiple. Five years ago the market paid an average of 69.7 times trailing earnings for this stock, inside a band of 57.2 to 82.2. Apply that average to $8.72 of trailing EPS and you get $608, which is almost exactly the 52-week high of $604. In other words, the peak was not a mistake in the business. It was the market paying its own long-run average, and once the price moved 35% lower the multiple went with it. At the low end of the band the shares would be $499, still 27% above where they sit.
The valuation now
Here is what the market is charging for the business today.
On the valuation tab, the current P/E of 43.8 sits at the 3rd percentile of its own five-year range. Price to sales is 12.2 against a five-year average of 18.0, the 5th percentile. Forward P/E is 39.1 on consensus EPS of $10.05, which implies about 15% profit growth from the trailing figure.
I would not read the percentiles as a bargain sign. Gauges of the same stock at the bottom of their range say the market has changed its mind about the multiple, and it says nothing on whether the new one is right. A stock can sit at the 3rd percentile for a year. Look at the level instead. 45.1 times earnings for a company growing profit in the mid-teens to 20s and holding a margin near 29% is a serious price, only a less absurd one than before. I asked the same of a retailer in Costco at 50 times earnings. The industry average P/E in our data is 36.7, so even now the premium is about 20%.
Analysts have not walked away. Of 21 covering, 86% rate it a buy. The average target of $490 is 25% above the price, the high of $685 is 74% above it. The lowest target, $391, is only 1% below. When even the bear on the sheet is roughly at the market, the stock has been reset, and I would treat that as information about sentiment more than about value.
Reading it next to other expensive stocks
The question of what to pay for a durable compounder comes up again and again. In the ASML piece I looked at a semiconductor supplier whose business quality is not in doubt and whose entry price is. Costco raised the same question about a retailer. Intuitive belongs in the same group, with a different cause of the premium: it is a medical franchise whose customers cannot easily switch, and the price reflects that.
The counter-case
I keep two objections against my own argument, and neither is small.
I keep two things against the bull argument. The first is the quant grade. StockVane’s model moved the stock to a D from a C over the last few weeks, which reflects the price weakness and the fall in the momentum inputs, and it has not turned. I do not think a quant grade is a verdict on a surgical robot, but it does say the tape has not turned yet, and I would not buy on the day the tape is still negative.
The second is the margin. If gross margin keeps sliding, say to 65% or lower with revenue growth still near 20%, then the story I am telling would be wrong in a specific way: the company would be buying its growth. That is the only outcome I can think of where a lower multiple stays lower. Short interest is 2.2% of float, which is light, so there is no crowded bearish position waiting to be squeezed either. Nobody is betting against the company aggressively, and that also means there is no fuel for a fast rebound.
One thing I will not cover. competing robotic systems and procedure volume by specialty. The database has none of that, and I do not want to guess at it. Those are the questions a longer note would need to answer, and the ones I would take to the company’s filings.
The growth rate below which I would walk away
My line is simple. At $393 the stock costs 45.1 times trailing earnings. If revenue growth stays above 15% and gross margin holds at 65% or better, the pullback is a repricing of a company still doing its job, and I would be comfortable owning it here in a small position. If either misses in the next report, the drop stops being a multiple problem and becomes a business problem, and I would want a price well below $391, because that is where the most cautious analyst already sits. It is the same test I applied to ASML: great business, and the entry price is the whole question.
Gavin Thorne has invested in U.S. stocks for six years and previously worked at a large publicly traded internet company. He writes about income-oriented strategies, including cash-secured puts, and about how he reads company data. This article reflects his personal research process and is for informational purposes only. It does not constitute investment advice.
Sources: Price-to-earnings ratio (SEC Investor.gov glossary) (https://www.investor.gov/introduction-investing/investing-basics/glossary/price-earnings-pe-ratio) · How to read a company's 10-K (SEC Investor.gov) (https://www.investor.gov/introduction-investing/investing-basics/glossary/10-k)