
On September 15, Adobe’s quant grade in our database was B, with a score of 77. On September 16 it was E, with a score of 5. A jump of 72 points in one day is not a gradual reassessment, and the grade has stayed at E ever since (a score of 3 on September 21).
I have to open with that because the title of this piece, which I chose when the grade was still a B, says the quant model disagrees with the market’s view that AI is bad for Adobe. As of today it does not. The model and the market now say the same thing, and the disagreement I meant to write about lasted a week. My thesis has had to change with it: what is left is a stock at 13.9 times trailing earnings, 32.5% below its 52-week high, where the only voices arguing for the business are its own financial statements. Those statements are better than the price suggests, and the price is right to ask whether they will stay that way.
What the model did, and what I can and cannot say about it
The database keeps a daily quant grade for each stock. For Adobe the sequence runs B at 73 on September 14, B at 77 on the 15th, then E at 5 on the 16th, drifting down to 3 by the 21st. That is a fall of 72 points in one step and then a slow slide to the bottom of the scale.
I do not have the components of the score, so I will not tell you which input tipped it. A drop that abrupt usually means a threshold was crossed in one of several sub-scores, not that all of them deteriorated at once, but that is an inference about how such models work, not something I can show here. What I can show is the context. Adobe reported on September 10 and the stock moved +1.4% that day. The grade was still a B on the 14th and 15th, four and five days after the report. Then it dropped.
Short version: the market thought AI would hurt Adobe. A quant screen disagreed for a week. Then it stopped.
So the honest way to put the title today is this: the market thought AI would hurt Adobe, a quant screen disagreed for about a week, and then it stopped. Take the earlier B as a reminder that the business numbers were not the problem. Read the E as the reminder that price and estimate momentum can turn against a stock whose numbers are fine.
The business the bears are pricing down
Adobe’s revenue, from the financials tab: $12.87 billion in FY2020 climbing to $23.8 billion in FY2025, with $15.79 billion in FY2021 and $21.50 billion in FY2024 along the way. Yearly growth went from 23% in FY2021 to 12% in FY2022 and then held at 10% or 11% for three years. After the 2021 surge it settled into a band of 10% to 12% and has stayed there for four years.
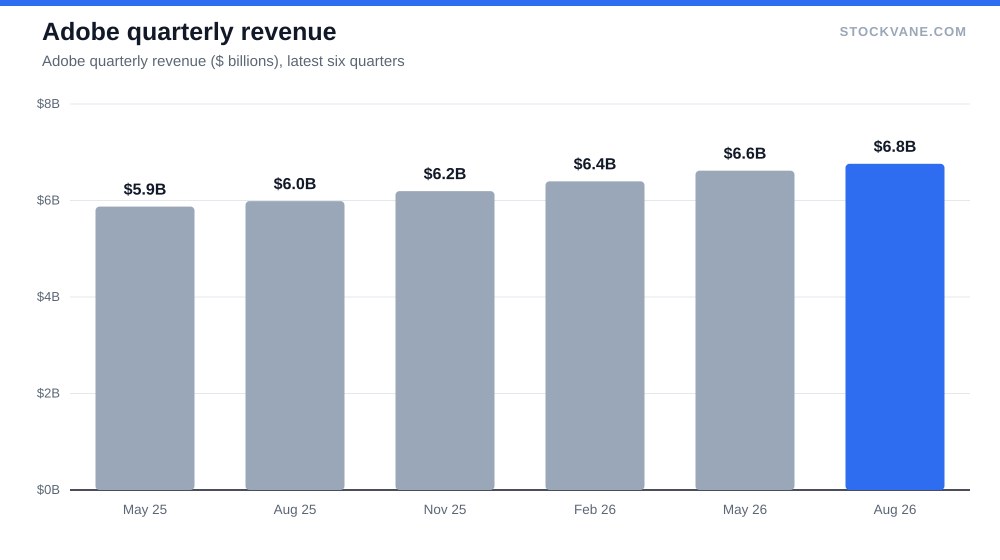
The most recent quarter, $6.8 billion, was up 13% from a year earlier. The quarters before it grew 10%, then 12%, then 13%. So if anything growth has edged up, not down, in the period when AI-native competition is supposed to be biting. One year of data does not prove the bear case wrong. But a company being disrupted usually shows it in the top line first, and here the top line has not yet shown it.
Then the part that is easy to overlook. Gross margin has risen from 86.6% in FY2020 to 89.3%. The database EBIT margin started at 33.4% in FY2020, dipped to 33.0% in FY2024, and reached 37.9% in FY2025. That last step, from 33.0% to 37.9%, is nearly five points in one year. (Operating income of $8.7 billion over revenue gives 37%; I use the database EBIT series for the trend and note the small difference.)
Where the profit growth came from
Operating income rose 12.5% in FY2025, from $7.74 billion to $8.7 billion. Net income rose 28%, from $5.56 billion to $7.1 billion. Diluted EPS rose 35%, from $12.36 to $16.70. Each measure grew faster than the one before it.
The gap between the first two is a lower gap between operating and net income, which usually means a smaller tax bill or fewer one-time charges. The gap between net income and EPS points to a shrinking share count. I have no buyback figures in this pack, so I cannot separate the pieces. What I can say is that the EPS growth of 35% was not earned by selling 35% more software; revenue grew 11%. If you are underwriting the stock on the $19.81 forward EPS, the question is how much of the next year’s growth comes from the same below-the-line effects, which do not repeat indefinitely.
The trailing EPS on the quote page is $17.91, above the $16.70 of the last fiscal year, and the forward figure implies 11% more. At revenue growth of 11%, that is roughly what you would expect from a company that holds margins and keeps repurchasing shares. It is not a forecast of acceleration.
What the multiple says
On the valuation tab, the P/E is 14.1 against a five-year average of 36.2; that puts the stock at 0.38 times its own history, the fifth percentile of its five-year range. Price to sales is 3.9 against 10.1, and price to book 8.5 against 13.6. On the forward numbers, the P/E is 12.6.
Against the industry, the gap is wide too. The industry average P/E in the database is 26.2, so Adobe at 14.1 is priced at about 54% of it. On price to sales the industry figure is 5.1 against Adobe’s 3.9. Adobe is not just cheaper than its own past; it is cheaper than its peers, with a gross margin of 89.3%. Price to book runs the other way (8.5 against 4.4), which reflects how little of Adobe’s value sits on the balance sheet: a software company with buybacks has small equity, and book value tells you little.
| Metric | Value | Context |
|---|---|---|
| Price (approx.) | $248.92 | 52-week range $190 to $369 |
| P/E (TTM) | 13.9x | Five-year average 36.2x |
| Price-to-sales | 3.9x | Five-year average 10.1x |
| Analyst ratings | 38% buy, 43% hold | 21 analysts; average target $274 |
That is the number the bears are paying for. If you assume AI takes a bite out of Adobe’s pricing and seats, the market has already taken 61% off the multiple relative to five years ago. The question is whether that is the whole bite or the first one. I do not think anyone knows. But a P/E of 14.1 on a business growing revenue at 11% with a 37.9% margin is a price at which the AI risk is not a footnote; it is most of the valuation.
For a comparison of how this kind of argument has played out elsewhere, see Walmart Trades Like a Software Company, which runs the same test in reverse: a retailer priced on a multiple its business does not earn. Adobe is the software company priced like a retailer.
Analysts: a real split, not a bad week
Twenty-one analysts cover Adobe. 38% rate it a buy, 43% a hold and 19% a sell; the analysts tab shows the consensus as Hold. Targets range from $195 to $373, an average of $274, 10% above the price of $249. The lowest target is -22% below the stock, and the highest is 50% above it.
The recent news feed shows how that split gets made. Morgan Stanley initiated coverage on September 4 with a Sell and a $240 target, and maintained it on September 9. BofA Securities held its Sell with a $220 target the same day it was initiated by Morgan Stanley. Barclays, on September 3, kept a Hold and raised its target to $295. So the same week contained a raised target and two sell calls whose targets sit below the price. A stock does not show this dispersion when its business is deteriorating in plain sight. It shows it when the business is fine and the terminal value is contested.
One more item from the feed, without inference: on September 17, a Form 144 filing showed an officer proposing to sell 31.44 million in common stock. That is a filing headline, not a verdict, and I have no data here on the holder or their history of sales.
What sets the stock’s path from here
The stock moved +1.4% on the September report. Before that came -6.8% in June and -7.6% in March. The average earnings-day move in the database is 4.5%. Two of the four reactions were sharp drops in reports where revenue grew 12% to 13%. That pattern says the market is trading Adobe on something other than the reported growth, and the natural candidate is the AI-disruption narrative.
Short interest is 4.4% of float, about four days of volume to cover. That is not a crowded short of the kind that squeezes. It matches the analyst tally: some people are betting against the stock, and not many.
On flows, the data on how money moves into and out of US stocks is a separate exercise, and I set out my method in How I Actually Analyze Money Flowing Into and Out of the US Stock Market. I have not applied it to Adobe here, and I would not draw a conclusion about who is selling from a headline.
What I am not covering
I have not tried to measure AI’s effect on Adobe’s product line. Adobe reports as a single segment in the database (Digital Media, Digital Experience and Publishing and Advertising together), so there is no split of Creative Cloud from the experience business to test the bear case against. I have no measured data on subscriber counts or AI-feature adoption. Anyone who gives you a figure for how much AI has already cost Adobe is guessing.
The date I would check the grade again
The quant model told us something for one week and then reversed itself, so I would not use it as evidence for either side. What I would use is the sequence of the next two quarterly reports, because both sides of the argument can be tested on them.
If Adobe’s revenue growth stays at 11% or above and the EBIT margin holds near the 37.9% it just posted, the multiple of 14.1 is pricing a decline that the reported numbers do not show, and I would call the stock cheap. If growth slips below 10% for two quarters running, the bears are right about the direction, and the price is only arguing about the size. Below the 52-week low of $190, I would stop asking about valuation and assume the market knows something about the next year that I cannot see.
Gavin Thorne has invested in U.S. stocks for six years and previously worked at a large publicly traded internet company. He writes about income-oriented strategies, including cash-secured puts, and about how he reads company data. This article reflects his personal research process and is for informational purposes only. It does not constitute investment advice.
Sources: Price-to-earnings ratio (SEC Investor.gov glossary) (https://www.investor.gov/introduction-investing/investing-basics/glossary/price-earnings-pe-ratio) · Stock options tax topic (IRS) (https://www.irs.gov/taxtopics/tc427)