
A bond fund yields 4%. Over the next twelve months rates rise by one percentage point, and the investor who bought it for safety finishes the year down 2.7%. Nobody lied to them. The yield was real and the price fell by more than the income paid, and the arithmetic behind that outcome fits on a napkin.
Bond ETFs are sold as the calm part of a portfolio, and a diversified one does not swing like a growth stock. But calm and insensitive to rates are different claims. My argument in this piece is that one number, duration, tells you most of what a rate move will do to a fund, and that a second number, the fund’s yield divided by that duration, tells you how much of a move the fund can absorb before you lose money. Both are printed on any fund’s page, and most buyers never look at either.
Why prices fall when rates rise
A bond pays a fixed coupon. Suppose you own one paying 4%, and the market starts offering 5% on new bonds of the same quality. Nobody will pay full price for your 4% coupon (the reason rates are so hard to call is in our piece on the Fed being stuck), so its price drops until its return matches the new bond. The fall is bigger the further away the final payment is, because you are stuck with the low coupon for longer.
Duration is a compact way to measure that, expressed in years. As a first approximation a fund’s price moves by its duration in percent for every 1 percentage point change in rates, in the opposite direction. A fund with 7 years of duration loses about 7% if rates rise a point and gains about 7% if they fall a point. The rule is approximate because price and yield do not move in a straight line. When rates move a lot, a second adjustment called convexity softens losses and boosts gains slightly.
I used both terms in the scenarios below. The three funds are illustrative, with durations of 2, 7 and 20 years and assumed convexity of 5, 60 and 400. None is a real product. I gave all three the same 4% yield so that the only variable is duration, which is the point of the exercise.
| Illustrative fund | Price change, rates +1 pt | Price change, rates +2 pts | Price change, rates -1 pt | First-year total return, rates +1 pt |
|---|---|---|---|---|
| Short-term Treasury fund (2-year duration) | -2.0% | -3.9% | +2.0% | +2.0% |
| Broad investment-grade fund (7-year duration) | -6.7% | -12.8% | +7.3% | -2.7% |
| Long-term Treasury fund (20-year duration) | -18.0% | -32.0% | +22.0% | -14.0% |
Read the first column of numbers before the others. A 1-point rise costs the short-term fund 2.0% of its price, the broad fund 6.7% and the long-term fund 18.0%. The same change in rates produced a loss nine times larger for the long fund than for the short one. The gap between them is duration and nothing else.
Falling rates work in the other direction, and the numbers are slightly kinder. A 1-point fall lifts the long fund 22% while a 1-point rise takes off 18%. That asymmetry is convexity, and it is the reason long bonds are not a pure loser when rates rise. It is also small next to the main effect.
The income cushion and how fast it runs out
Price is only half of what a bond fund returns. The other half is income, and this is where a buyer can be misled in either direction. Optimists point to the 4% yield as a buffer. Pessimists point to the price loss and ignore the income. Both are half right.
Here is a way to see it. Imagine two friends who each bought a bond fund on the same day. One chose a fund with 2 years of duration, the other a fund with 20. A year later rates are 0.5 point higher. The first friend has lost about 1% in price and collected 4% in income, so she is ahead by roughly 3%. The second has lost about 10% in price against the same 4% of income, and is behind by about 6%. Same yield, same rate move, opposite outcomes. Neither made an error of judgment. They chose different amounts of rate risk without knowing it.
The useful question is how much rates can rise before a year of income is fully offset. Divide the yield by the duration. For the short-term fund, 4% over 2 years gives 200 basis points of room, or 2 full percentage points. For the broad fund it is 57 basis points. For the long fund it is 20. Rates rising by more than those margins in a year, and the fund’s total return turns negative.
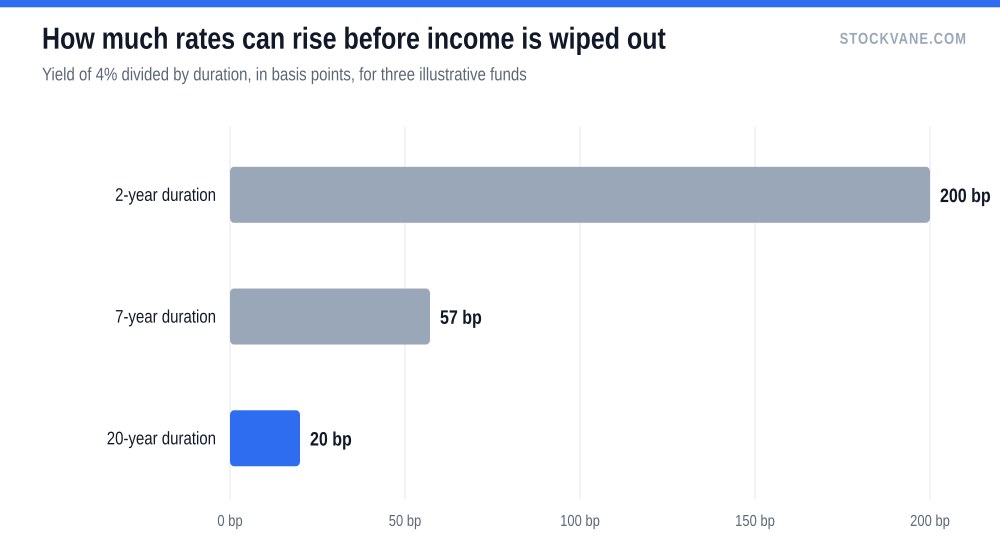
The result looks harsh for the long fund, and it should. A 20-basis-point rise in rates is a normal week for the bond market in a volatile year, and a fund that needs rates to stay within 20 basis points to break even is a bet on the direction of rates rather than a cushion. The short-term fund could absorb a full 2-point rise and still break even on the year.
For the first-year total return, my table assumed a 1-point rise: +2.0% for the short fund, -2.7% for the broad one and -14.0% for the long one. That is only the first-year figure. The following years benefit from the higher yield the fund now earns, which is why a fund that lost money on a rate rise can end up ahead of one that never fell, given enough time. The time it takes is roughly the duration.
Roughly, the price loss is recouped by higher income after about as many years as the fund’s duration. A 7-year fund that fell 7% needs about seven years of the extra yield to make it back. A 20-year fund needs far longer than most investors plan to hold it.
What happened in 2022, approximately
The last real test came in 2022, when the Fed raised rates at the fastest pace in decades. Broad U.S. bond funds lost roughly 13% that year, and long-term Treasury funds lost about a third. I am quoting those from memory and only approximately, because our database does not carry bond fund history. They line up with the scenarios above once you account for how far rates moved, and they were the worst years for bonds in a long time.
That is why the counter-argument matters. If rates fall, the same duration works in your favor, and a long-term fund can pay off well. Someone who expects cuts has a legitimate reason to own duration. The issue I am raising is narrower: the buyer should choose that exposure knowingly, and not stumble into it because the fund has “bond” in its name. Our note on the Fed’s September 16 hike is about exactly that trade, and it is a bet on the direction of rates and not a safe-harbor position.
Where stocks fit in
Bonds also compete with stocks for the income slot. Of the 300 stocks in StockVane’s coverage, 244 pay a dividend and only 31 yield 4% or more. That is one reason a 4% bond fund gets attention. But the two are different bets: a dividend can be cut, and a stock’s price does not fall by a mechanical formula when rates rise. If yield is the goal, our comparison of high dividend yield and dividend growth covers what the payout can and cannot promise.
What I would not conclude
Duration is an average, and a fund with 7 years of duration can hold bonds ranging from 1 year to 30 years. Credit risk is a separate matter, since corporate bond funds can lose money when spreads widen even if Treasury yields stand still. Taxes and fees matter, and so does the fund’s actual yield, which is different from the 4% I assumed. None of that overturns the main point. It only means the scenarios are a starting frame and not a forecast.
Also, a short-term fund is not risk-free. If rates fall sharply it earns less than a longer fund would have, and if inflation runs above its yield it loses in real terms. What it offers is a narrow range of outcomes, which is worth something and is not the same as safety.
The one number to look up before buying
Open the fund’s page (if you need help finding data like this, our guide to research tools for beginners is a start) and find effective duration, then the 30-day SEC yield. Divide the second by the first. If the answer is above 100 basis points, the fund can absorb a full point of rate rise in a year and still break even. If it is below 50, as with the broad fund in the table, I would treat the position as a view on rates and size it the way I would size a stock I had an opinion on. And if you cannot find the two numbers in a minute, I would keep the money in something shorter until you can.
Financial disclaimer: The content on StockVane is for educational and informational purposes only and should not be construed as professional financial advice. Stock market investing involves risk of loss.
Sources: Dividends (SEC Investor.gov glossary) (https://www.investor.gov/introduction-investing/investing-basics/glossary/dividend) · Dividends tax topic (IRS) (https://www.irs.gov/taxtopics/tc404)