
Take the ten largest Nasdaq-listed companies in StockVane’s coverage and add up their market values: $31.1 trillion. The 293 U.S.-listed stocks worth $50 billion or more that we track add up to $80.0 trillion, so those ten names alone are 39% of that entire pile. They outweigh the smallest 194 of the 293 combined, $17.4 trillion, by a factor of 1.8.
Now put that inside a fund that advertises 100 holdings.
That is the situation with Invesco QQQ, the fund most people buy to own “the Nasdaq.” StockVane does not store fund holdings, so I cannot show you QQQ’s exact weights from our own database. The fund’s fact sheet at Invesco is the place to check them, and my recollection is that the top ten sit at approximately 48% of assets, which is what the title means by almost half. What I can measure is the market-value skew behind that weighting. My view: a cap-weighted 100-stock fund is a bet on about ten companies with 90 supporting actors, and how that bet has worked over the past year depended almost entirely on which ten and which one of them.
What the ten are, and what they weigh
I built the ten from our database: Nvidia, Apple, both Alphabet share classes, Microsoft, Amazon, Broadcom, Meta, Tesla and Micron. That is my own classification, the ten largest Nasdaq-listed names in our data, and the fund’s actual top ten can differ at the edges. Two large companies that would otherwise rank in between, Taiwan Semiconductor and Berkshire Hathaway, do not trade on Nasdaq.
The table shows the values as of September 18, 2026, next to each stock’s price change since September 19, 2025.
| Company | Ticker | Market value | Share of the ten | Price change, one year |
|---|---|---|---|---|
| Nvidia | NVDA | $5.36T | 17.2% | +26% |
| Apple | AAPL | $4.91T | 15.8% | +37% |
| Alphabet (Class A) | GOOGL | $4.27T | 13.7% | +38% |
| Alphabet (Class C) | GOOG | $4.21T | 13.5% | +35% |
| Microsoft | MSFT | $3.67T | 11.8% | -4% |
| Amazon | AMZN | $2.74T | 8.8% | +10% |
| Broadcom | AVGO | $1.71T | 5.5% | +4% |
| Meta Platforms | META | $1.70T | 5.4% | -14% |
| Tesla | TSLA | $1.44T | 4.6% | -15% |
| Micron Technology | MU | $1.15T | 3.7% | +525% |
Nvidia is worth $5.36 trillion by itself. Micron, the smallest of the ten at $1.15 trillion, is still larger than most of the S&P 500. The gap between first and tenth is a factor of about 4.7, and it is that gap, more than the count of holdings, that decides how a cap-weighted fund behaves.
Alphabet appears twice, which matters for counting. Class A and Class C are one business, so when we say ten names, one company holds two of the slots and the ten cover nine businesses. Our earlier piece on why Alphabet is the cheapest big tech stock explains why that single company is worth watching on its own.
One year, ten stocks, one outlier
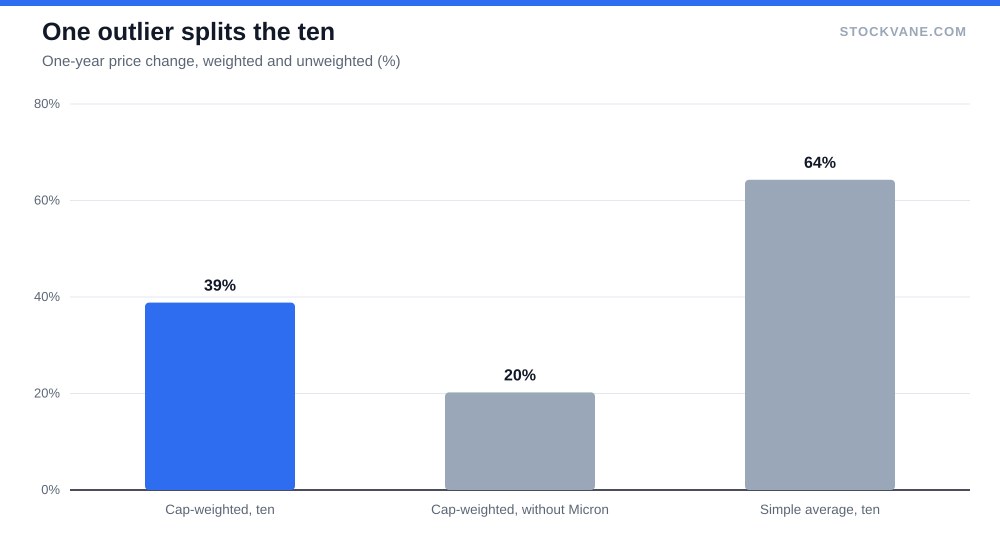
Over the year to September 18, 2026, the cap-weighted gain of the ten was 39%. The simple average was 64%. Those two figures disagree by 25 points, and the reason is Micron, up 525% on its own.
Micron is only 3.7% of the ten by value, so it barely moves the cap-weighted figure, but a 525% gain is large enough to drag a simple average to 64%. Take Micron out and the cap-weighted gain of the other nine is 20%. So the honest reading of the past year is a two-speed story: 39% if you hold the ten in proportion to their size, and roughly 20% for the nine that are not a memory-chip rebound.
Not every one of the ten went up. 3 of them fell. Microsoft is -3.9%, Meta -14.2% and Tesla -14.5%. Apple, Alphabet and Nvidia gained 37%, 38% and 26%. Same fund, same top ten, and a spread from a loss of 14% to a gain of 525%.
Set that against the rest of the coverage. The median stock among the 293 rose 23% over the same year, and 206 of the 293 finished higher. The ten’s cap-weighted 39% therefore sits well above the typical large cap, which is what you would expect when the largest companies are also the ones that rallied. It also means the fund’s headline return says more about those ten than about the market it is supposed to represent. Outside the fund, the picture is uneven: Oracle, which trades on the NYSE and so is not in the Nasdaq-100, fell 52% over the year, and our piece on Oracle’s backlog and what the stock says about it is a reminder that large caps can lose half their value in a year while the index-leading names climb.
That comparison is a fair test of whether concentration helped. It did, by a wide margin: the cap-weighted ten beat the median large cap by about 16 points. It is one year of data, though, and one year is short. A single stretch in which the largest names led says nothing about the following one.
Why concentration matters in both directions
Suppose the top ten weigh 48%, my approximate figure. Hypothetically, if those ten fall 20% while the other 90 holdings do nothing, the fund loses 9.6%. If the other 90 rise 10% while the ten do nothing, the fund gains only 5.2%. That arithmetic, not a forecast, is why owning 100 stocks and owning ten are not the same thing. The ten set the direction. The 90 modify it.
Chip stocks show the effect most clearly. When a group rallies as hard as memory names did, its weight in a cap-weighted fund climbs with the price, and nobody has to decide to buy more. Our look at AMD in 2026 covers one such chip move in detail. Micron went from a small position to $1.15 trillion, and a fund that owned it at last September’s weight now owns several times as much.
That drift cuts both ways for a buyer. Someone who put money into QQQ a year ago did not choose to own more Micron or less Microsoft, yet the fund made both choices for them. The weights you hold today are the result of the last twelve months of returns, not a view about the next twelve.
The upside of that structure is obvious from the past year. A fund that holds the winners in proportion gets their gains automatically, without anyone having to pick Micron. Cap-weighting is a momentum rule by construction: what has risen is what you own more of.
The downside is the mirror image. When leadership turns, the fund is at its most exposed to the names that just did the most, because their weights are the largest at that moment. QQQ closed at $721.45 on September 18, 3.5% below its 52-week high of $747.83. Its 52-week low-to-high range was 34.7%. A range that wide for a fund of 100 stocks tells you the ten are driving it.
There is a fair counterargument, and I take it seriously. The ten are among the most profitable companies in the world, and a fund that concentrates in them owns the businesses that have produced the earnings. Concentration has been rewarded. My point is only that the reward is not diversification, and it does not come with a guarantee that the same ten stay on top. Ten years ago the list would have looked different, and I would not assume the next ten years agree with today’s.
One more way to see it: equal-weighting the ten would have produced the 64% average, and cap-weighting produced 39%. Neither is QQQ’s return, since the fund holds 90 other names, but the distance between them shows how sensitive any 100-stock cap-weighted result is to the choice of weighting rule. Small changes in how Micron or Nvidia are counted move the answer by tens of points. Changes to the other 90 names would barely register.
What I am not covering
Three things sit outside this piece. First, QQQ’s expense ratio and its tracking of the index, which are minor next to the weighting question. Second, the index’s rebalancing rules, which cap some weights at periodic intervals and can change the exact percentages I cited. Third, whether the ten are expensive. Their valuations differ enormously, and a single number for the group would hide more than it showed.
What would prove this framing wrong? A year in which the other 90 holdings clearly outran the ten. If the median large cap in our 293 starts to beat the cap-weighted ten over a full year, the concentration is no longer paying and the fund’s structure becomes a cost. Today the median is 23% against 39%, so the test is not close to being met.
The weight I would check before adding
Before buying more QQQ, I would open the fund’s fact sheet and read one line: the combined weight of the top ten. Then I would compare it with what I already own, and when one of the ten reports, I would read the quarter with the method in our guide to reading an earnings report, because a single miss now moves the whole fund. If my portfolio holds Apple, Microsoft, Nvidia and Alphabet directly, a QQQ position adds to a bet I have already made and does not diversify it.
The number to watch is the top-ten weight itself. If it is near 48% or higher when you check, treat QQQ as a ten-stock position with a wide net beneath it and size it that way. If the fund’s top ten weight drops toward 40%, leadership is broadening and the fund is becoming the diversified product the label promised.
Financial disclaimer: The content on StockVane is for educational and informational purposes only and should not be construed as professional financial advice. Stock market investing involves risk of loss.
Sources: Earnings reports (SEC Investor.gov glossary) (https://www.investor.gov/introduction-investing/investing-basics/glossary/earnings-report) · How to read a company's 10-K (SEC Investor.gov) (https://www.investor.gov/introduction-investing/investing-basics/glossary/10-k)