
The regular dividend Progressive pays is ten cents a share. It has been ten cents in every one of the twelve quarterly payments in our dividend history, going back to January 2024. On a stock at $213.48, that is a yield of 0.19%. The same stock shows a 6.51% yield on our quote page, and both numbers are accurate.
The gap between them is where the investment case lives. Progressive paid about $13.90 a share over the last twelve months, so roughly $13.50 came from outside the regular ten-cent checks. My view is that PGR is not a dividend stock in any ordinary sense. It is a total-return holding that happens to hand back a large share of its profit in a formula-driven payment, and the question for an income investor is how much of the last payment will repeat. On current numbers, I would plan on less.
Where the other $13.50 comes from
Progressive pays an annual variable dividend on top of the small quarterly one. As the company has described it, the amount is tied to the prior year’s underwriting profit, and it is declared once a year, usually late in the calendar year. Our dividend table lists only the ten-cent payments, so the variable amount does not appear there. I am inferring it from the snapshot’s trailing dividend of $13.90 minus the $0.40 of regular payments. The company’s own dividend policy is the source to check before relying on that figure.
The structure matters because a formula pays what the year earned and nothing more. A utility raises its dividend by a few cents and stops thinking about it. Here the payment is a moving share of results, so it should be read against earnings, not against last year’s check. Last year’s $13.90 was 72% of the $19.23 of diluted EPS Progressive earned in fiscal 2025. That is a generous share, and it says the recent yield sits on top of an extraordinary year, not an average one.
| Variable dividend case | Total per share | Yield at today’s price | Share of trailing EPS |
|---|---|---|---|
| Skipped entirely | $0.40 | 0.2% | 2% |
| Half of last year’s amount | $7.15 | 3.3% | 36% |
| Same as last year | $13.90 | 6.5% | 70% |
| 20% more than last year | $16.60 | 7.8% | 83% |
The table shows how much rides on the variable piece. If it were skipped entirely, the yield at today’s price would fall to 0.19%. If it merely repeated last year’s amount, the yield would be 6.5% again. Anything in between is a judgment about underwriting results that our data cannot make for you.
The earnings behind the payment
The financials tab explains how a ten-cent company became a $13.90 payer. Diluted EPS was $1.18 in fiscal 2022, a year of weak underwriting. Then $6.58 in 2023, $14.40 in 2024 and $19.23 in 2025. Net income went from $0.72 billion to $11.3 billion in three years, on revenue that grew from $49.6 billion to $87.6 billion.
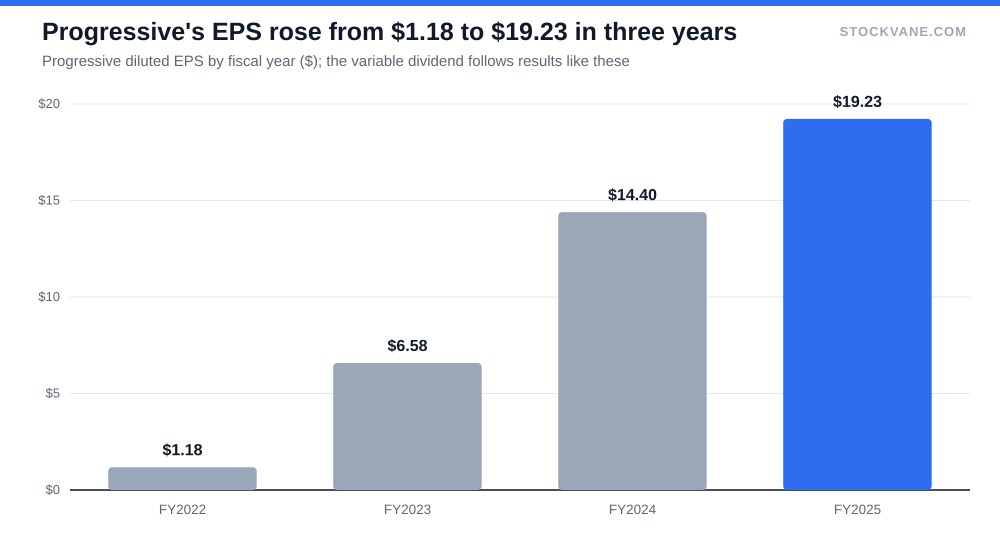
Read that chart carefully, because it also carries the warning. A payment linked to underwriting profit would have been small after 2022 and large after 2025. Nothing about the formula makes the profit sustainable. It only passes it along.
The latest quarters suggest the tailwind is fading. Revenue was $23.6 billion in the most recent quarter, up 7% on the year, after growth of 14%, 12% and 9% in the three quarters before it. Net income was $3.31 billion, up 4%, after 12%, 25% and 10%. The net margin held at 14%, the same as a year earlier, so this is a slowdown in growth, not a squeeze on profitability. I would still put it on the list of reasons why last year’s payment is the high-water mark and not the base case.
I have not discussed the combined ratio, the standard measure of insurance underwriting profit, because it is not in our data and I would rather leave it out than estimate it. It is the number that most directly drives the variable payment, so anyone forecasting the year-end dividend should start with the company’s own releases.
Personal lines, mostly auto, was $19.2 billion of the quarter, or 81% of revenue. Commercial lines added 11%. Investment income was $0.98 billion and net holding-period gains on securities $0.59 billion. That last item is market-dependent, so it is not something I would extrapolate.
What the multiple already assumes
At 10.7 times trailing earnings, the valuation tab shows PGR cheaper than it looks against its own history. The five-year average P/E is 35.9, but that average is distorted by fiscal 2022, when $1.18 of EPS produced a triple-digit multiple, so I would not use it as a benchmark. The industry average of 9.7 is a better reference, and PGR sits a little above it. Price to book is 3.7 against a five-year average of 4.7 and an industry figure of 2.0. Return on equity was 34.9% in the latest quarterly ratios, which is why a book multiple well above the industry is not alarming by itself.
The forward multiple carries the more useful message. It is 13.0, which is higher than the trailing figure, and at today’s price it implies analysts expect about $16.50 of earnings over the next year, against $19.90 over the last twelve months. That is a decline of 17%. If the total dividend keeps following earnings at about 70%, as it did over the last year, a payout of 70% of $16.50 would be about $11.50, some 17% below the $13.90 paid over the last twelve months. That is my arithmetic, not a forecast from the company, and it rests on a payout ratio I have assumed.
There is a fair case against that reading. Analyst estimates for a fast-growing insurer can lag actual results, and the three-year climb in EPS in the chart above is the best evidence for it. I take it seriously and still would not pay for the higher figure in advance.
One year in total-return terms
A year ago, on September 8, the stock closed at $230.94. Today it trades at $213.48, a price decline of 7.6%. Add the $13.90 of dividends and the total return is about minus 1.5%. That is a fair picture of why the price and the yield tell different stories: the payment offset nearly all of the decline, and it did so in a year when the shares fell. One year is also an accident of dates. The variable dividend arrives in a single lump, so a window that happens to include it flatters the total return and one that misses it understates the result. The stock is now 11% below its 52-week high of $239.38 and 14% above the low of $187.78.
Earnings-day reactions have been small. The last four moves were 0.1%, 0.0%, minus 2.2% and minus 5.8%. Short interest is 1.0% of the float with 2.6 days to cover, and an officer sold $8.2 million of stock on September 3. One insider sale tells me little, and I mention it only because it is in the news feed.
Analysts are split, and so is the model
Of the 17 analysts covering the stock, 47% rate it a buy, 47% a hold and 6% a sell. A split that even is unusual for a company that just earned $11.3 billion in a year, and I read the many holds as analysts saying the good news is in the price. The average target is $240, 12% above the price. The range runs from $201, 6% below it, to $309, 45% above. Mizuho kept a Hold on September 16 and cut its target to $230, and UBS held at $234 in late August. Morningstar rates the stock two stars with a fair value of $198, which puts the price about 8% above it, and it describes auto insurance as a business where products are essentially commodities and competition is fierce.
The StockVane quant rating fell to a D with a score of 22 on September 16, from a B at 71 the day before. I do not use the score as a signal on its own. It reads price and valuation inputs, and a swing that size in a day says more about the model’s thresholds than about the company.
Sizing it as a total-return holding
I would own Progressive for what it earns, not for what it pays in October. The regular dividend is a rounding error. The variable dividend is real money, and this year it is likely to be smaller if analysts’ earnings estimates are right. At about $213, the stock is fairly valued to slightly rich by the two outside references I have, Morningstar’s $198 and a multiple that is a little above its industry.
Our piece on high yield versus dividend growth makes the general case for why a yield that swings with earnings deserves a smaller weight than a payment that grows steadily. The practical application here is simple. Count the regular dividend as 0.19%, treat the variable payment as an estimate that is probably lower than $13.50, and size the position as if it might be zero.
The number to watch is the variable dividend the company declares at year-end. If it comes in at $11 or more, the 6.5% headline will have held up and my caution was too much. If it lands below $9, the yield on the quote page will have to be rewritten.
Financial disclaimer: The content on StockVane is for educational and informational purposes only and should not be construed as professional financial advice. Stock market investing involves risk of loss.
Sources: Dividends (SEC Investor.gov glossary) (https://www.investor.gov/introduction-investing/investing-basics/glossary/dividend) · Dividends tax topic (IRS) (https://www.irs.gov/taxtopics/tc404)