
Six Decembers in a row, CME Group has paid a special dividend on top of its regular quarterly checks, and the amount has never fallen: $2.50 in 2019 and 2020, then $3.25, $4.50, $5.25 and, in 2024, $5.80 a share. The last one was 4.5 times the $1.30 regular payment now being declared each quarter. A screen that reads only the quarterly figure misses most of the story.
The stock closed at $276 on September 18, 13.3% below its 52-week high of $318. The quote page shows a dividend yield of 4.08% and trailing dividends of $11.25 a share. Take the regular payment alone and the yield is 1.9%. The distance between those two numbers is the subject of this post, and it is also where the data gets awkward, so I will show what the dividend table itemizes and what it does not.
Two dividends with different logic
The regular dividend is the part you can plan around. It went from $1.10 in late 2023 to $1.15 through 2024, to $1.25 through 2025 and to $1.30 from the March 2026 payment. Three raises in about two and a half years, each of them small, each of them paid four times a year. At $1.30 a quarter the annual run rate is $5.20.
The special is a different instrument. CME describes its policy as a variable annual dividend that returns excess cash after the company has funded operations and its capital needs. I am paraphrasing from the company’s public policy and have not verified the current wording, so treat it as a description rather than a quote. What the payment records show is simpler: one extra payment per year, declared in December, ex-dated in the last week of the month, and sized by how the year went.
| Year | Special dividend ($/share) | Regular quarterly payment in December ($) |
|---|---|---|
| 2019 | 2.50 | 0.75 |
| 2020 | 2.50 | 0.85 |
| 2021 | 3.25 | 0.90 |
| 2022 | 4.50 | 1.00 |
| 2023 | 5.25 | 1.10 |
| 2024 | 5.80 | 1.15 |
Look at what happened in the two years where the table gives a full picture. In 2023 the four regular payments came to $4.40 and the special added $5.25, for $9.65 in total against diluted earnings of $8.86. In 2024 the regular payments were $4.60, the special was $5.80, and the total of $10.40 compared with earnings of $9.67. Both years paid out roughly 108% to 109% of that year’s diluted EPS. Which means the special was not a bonus from a spare pile of cash so much as a release of retained earnings from prior periods, and it only works while the company keeps a large cash buffer.
In 2024 the special alone was 56% of everything shareholders received in dividends.
Why a yield screen gets it wrong
Screens usually do one of two things. They multiply the latest quarterly payment by four, or they sum the payments in the trailing twelve months. The first approach gives CME a yield near 1.9% and drops it below most income lists. The second gives 4.08% and lifts it above them. Neither is a forecast of what you will receive, because the second counts a payment that may or may not repeat in the same size.
That is why I would not use a trailing yield on this stock without splitting it in two. The regular piece, 1.9%, is the floor. It has been raised every year in the table and has no sign of stress: the annual regular payment of $5.20 is about 44% of trailing EPS of $11.79. The variable piece is a decision the board makes once a year, and there is no contract behind it.
Our piece on high yield versus dividend growth makes the general argument that a payout you can count on is worth more than a payout that looks large on a screen. CME is a case where both live in the same ticker.
The gap I cannot close
Now the awkward part. The trailing dividend figure on the quote page is $11.25. The dividend table lists $5.15 in ex-dates over the twelve months to September 18: the December 2025 payment of $1.25 and three payments of $1.30 in March, June and September 2026. That leaves $6.10 a share that I cannot tie to a row.
Two explanations fit. One is that a special dividend was declared for 2025 and is missing from the table. The other is that the snapshot counts a payment on a different date basis than the table does. The table has no ex-date between December 12, 2025 and March 10, 2026, and I have no news item in the database that settles it. I am not going to guess at an amount.
What I can say is what each reading implies. If a special of about that size was paid for 2025, it would be another step up from the $5.80 of 2024, consistent with earnings growth of 15% that year, from $3.5 billion to $4.1 billion. If it was not paid, then the 4.08% yield overstates what a new buyer would collect, and the honest number is the regular yield plus whatever the board declares in December. Check the company’s own dividend history page before you rely on either figure.
What funds the special
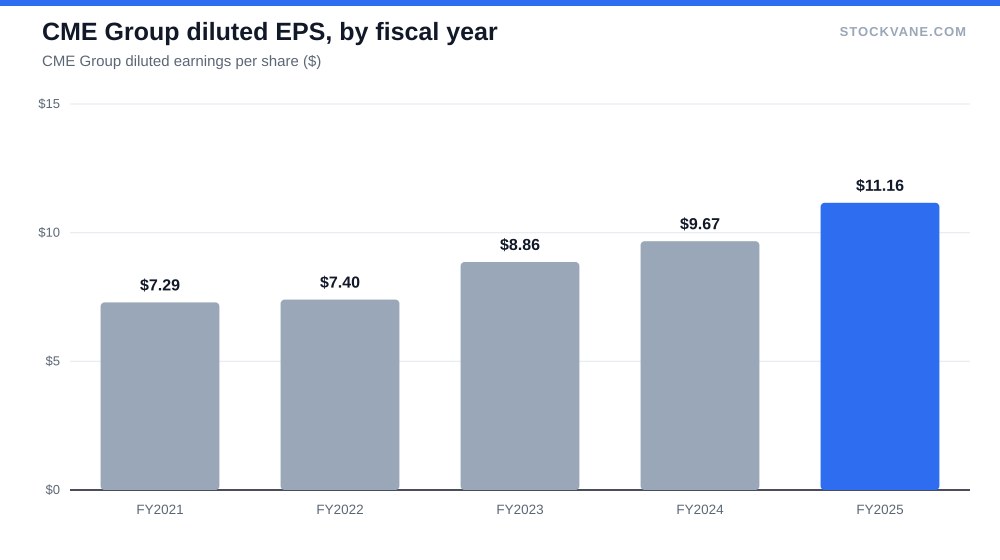
Earnings per share is the base that any special has to be sized against, so the chart above tracks it year by year. Diluted EPS went from $7.40 in 2022 to $8.86, $9.67 and then $11.79 on a trailing basis. Growth of that kind is what let the special rise while the regular payment also rose. A flat year for EPS would put the two in competition.
The cash comes from a business that keeps most of what it earns. Revenue was $6.5 billion in 2025, up 6% from $6.1 billion, and net income was $4.1 billion, a net margin of 62%. Gross margin was 86.1% in both of the last two years. Few businesses convert revenue into distributable profit that efficiently. The reason is structural: an exchange collects a fee on every contract that trades and does not need to build much inventory to do it.
Revenue is also tied to how much people trade. The second quarter of 2026 brought in $1.7 billion, up 1% from the same quarter a year earlier, but down 9% from the 1.88 billion of the first quarter, which had been up 14% year on year. Interest-rate products were the largest line at 25% of second-quarter revenue, followed by equity indexes at 19% and market data at 14%. Energy and agricultural products were about 11% each, and metals 4%.
That mix matters for the special, because rate futures volume rises when investors argue about the Fed. Our take on the September 16 Fed hike covers why that meeting was a trading event in itself. A quiet rate path is not good for this line.
Valuation, briefly
The trailing P/E is 23.4, against a five-year average of 25.9, and the forward P/E is 22.1 on expected EPS of $12.48, which implies 6% growth. On the valuation tab the P/E sits at the 12th percentile of its five-year range, while price to book of 3.7 is at the 90th. I read that as a stock that is cheap on earnings and expensive on assets, which is what you would expect from a business with almost no tangible capital.
Analysts are lukewarm. Of 10 covering it, 40% rate it a buy, the average target is $279 (upside of 1%), and targets run from $230 to $330. Short interest is 1.6% of float. None of that suggests a crowded trade. It suggests the market treats CME as a utility with a variable bonus, and prices it that way.
Compare it with another toll-road business. Visa is the case where the forecast question is who builds the bypass. For CME the equivalent question is whether volume stays high enough to sustain a payout of more than 100% of earnings, and no rival is building a bypass for the same contracts.
What I am not covering
I have not modeled the December declaration because the company does not publish a formula, and I have no earnings estimate broken down by quarter to fit one. I also have not adjusted for taxes: in the US, special dividends are ordinarily taxed like regular ones, but your own situation is your own. And the table starts only in 2006, with gaps in some years, so I limited the run of specials to 2019 through 2024, where every December has a record.
For readers who want a refresher on parsing the cash-flow side of a report, how to read an earnings report is the place to start.
The December declaration to watch
The next earnings date on the calendar is October 21, and the average one-day move on CME’s last several reports has been 1.6%, with the last one, in July, at +5.0%. That is a quiet stock on report days. The number that matters comes later: the December declaration. Since 2019 it has never been lower than the year before. If the 2025 special was in fact paid and this year’s comes in under about $5.80, I would treat that as the first real crack in the payout policy. If the board pays nothing extra, the stock is a 1.9% yielder and should be priced like one.
Financial disclaimer: The content on StockVane is for educational and informational purposes only and should not be construed as professional financial advice. Stock market investing involves risk of loss.
Sources: Dividends (SEC Investor.gov glossary) (https://www.investor.gov/introduction-investing/investing-basics/glossary/dividend) · Dividends tax topic (IRS) (https://www.irs.gov/taxtopics/tc404)