
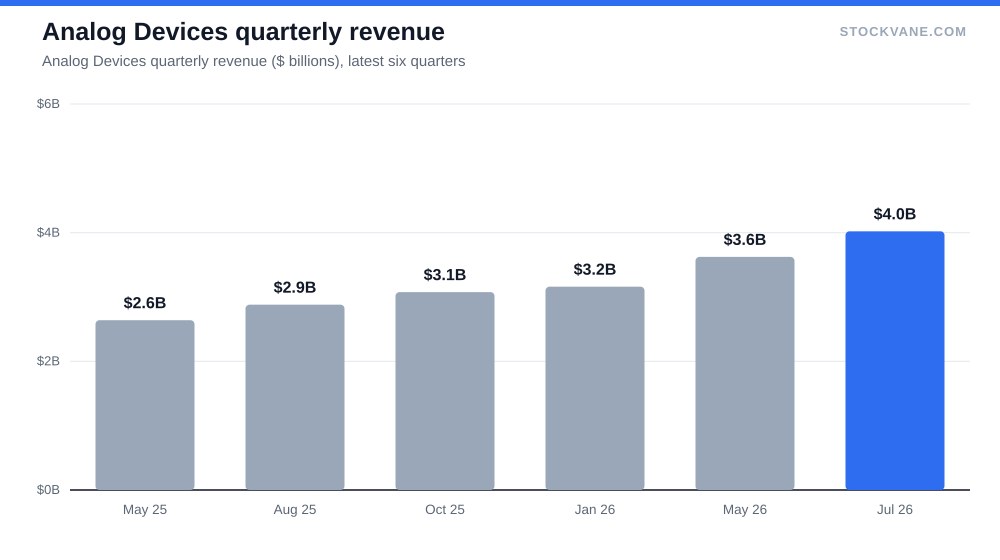
Four quarters, four growth rates: 26%, 30%, 37%, 40%. That is Analog Devices’ year-over-year revenue growth in each of its last four reported quarters, and the July quarter closed the run at $4.0 billion, up 40% from a year earlier and 11% above the quarter before it. Yet the stock changed hands on September 18 at $375.72, 15.5% under its 52-week high of $445.
A company that accelerates for four straight quarters and still trades below its peak is telling you something, or the market is. I think the message is narrower than it looks, and it is not that growth has been priced out. It is that the base is unusual: this business shrank hard, and what we are watching is recovery arithmetic that has to turn into something more durable.
My working view: Analog Devices is a good business at a full price, and the 40% print is the easiest comparison it will ever get. The stock needs the margin line and the order book, not the growth rate, to carry it from here.
The staircase and the hole it climbs out of
Analog Devices sells the chips that sit between the physical world and the digital one: converters, amplifiers, power management parts that turn temperature, motion, voltage and radio signals into data. Industrial, automotive and communications equipment are the main customers, and the company reports as a single segment, so there is no fast-growing division to hide behind. The whole $4.0 billion quarter is one number.
Now the hole. Revenue hit $12.0 billion in fiscal 2022, edged up to $12.3 billion in 2023, then fell 23% to $9.4 billion in 2024 as customers worked down inventory they had over-ordered during the shortage years. Fiscal 2025 recovered to $11.0 billion, up 17%. Read that carefully: even after a full year of recovery, annual sales were still 8% below the 2022 level.
The current quarter, annualized, comes to $16.1 billion. That is 34% above the 2022 peak. So the recovery is not merely finished; it has gone through the old ceiling. Whether that is cyclical rebound or a higher plateau is the question I care about, and one quarter cannot settle it.
Two sources of growth are mixed here. Some of it is normalization, customers buying at the rate they consume after two years of destocking. The rest would be genuine new content per system, more chips in each car and each factory line. A summary of the August earnings call in our news feed carries the headline “AI Evolution Drives New Growth Cycle”, which tells you where management wants investors to look, though a headline is not a demand figure. I read the sequential 11% step as more informative than the year-over-year figure, because sequential growth is not flattered by a depressed base.
Earnings grew faster than sales, as they should
Operating gearing is the reason the earnings line moves more than the sales line in this kind of recovery. Analog Devices carries a fixed cost base of fabs and engineers. When volume falls, margins compress; when volume returns, most of each extra dollar drops through.
The record shows it. Gross margin was 57.1% in fiscal 2024 and 61.5% in fiscal 2025, a gain of roughly 438 basis points. The DB operating margin, which is EBIT over revenue, went from 22.3% to 27.5%. Net income rose from $1.6 billion to $2.3 billion, a 21% net margin, and the per-share figure went from $3.28 to $4.56.
Then the July quarter did more. Diluted EPS of $2.74 was up 163.5% from a year earlier, roughly four times the growth in sales. That gap is what operating gearing looks like at the top of a recovery. It is also the reason to be careful. Gearing cuts both ways, and the same fixed cost base that turned 40% sales growth into 163% profit growth would turn a 10% sales decline into something ugly.
Trailing earnings per share now stand at $8.42. Analyst estimates for the coming fiscal year sit at $13.46, which is 60% higher. Sell-side numbers are opinions, but they tell you what the current price already assumes, and the price assumes that the fourth-quarter run rate broadly holds.
What 44.6 times earnings is paying for
The trailing P/E is 44.6, and that number looks alarming until you compare it with the company’s own history. Its five-year average is 48.7, so today’s multiple is 0.92 times its average, and the stock sits at the 36th percentile of its own range. Part of the premium is an artifact: because trailing earnings still include quarters from the trough. On forward estimates the P/E drops to 27.9, which is 37% lower than the trailing figure.
Against peers the picture is less flattering. The semiconductor group averages a P/E of 30.7, so Analog Devices trades at roughly 1.4 times the group on trailing earnings and about 0.9 times on forward earnings. On sales and book value the stock looks fuller: price to sales is 12.6 against a five-year average of 10.3 (81st percentile), and price to book is 5.2 against 3.3 (88th percentile). Investors are paying more per dollar of assets and revenue than they have on average, and less per dollar of earnings. That mix is typical of a margin recovery: earnings are still catching up to what the revenue base implies.
I would not call this stock cheap, and I would not call it stretched either. If I compare it with another semiconductor name I have covered, ASML commands a premium for a monopoly-like position in lithography; Analog Devices has no such single choke point, so its premium should be smaller and its margin of safety thinner. AMD went through its own repricing on acceleration, and I wrote that up earlier. It is a useful contrast.
Nobody on the Street is arguing about the quarter itself, only its price.
The Street and the tape
Twenty-one analysts cover the stock and 95% rate it a buy, with none at sell. The average target of $482 implies 28% upside from here; the low target of $405 is still 8% above the price, and the high target of $675 is 80% above it. When the most bearish published number is above the current price, the consensus is not really debating direction. It is debating magnitude, and that is a warning about crowding rather than comfort.
Reactions to reports have been uneven. After the last four earnings reports the one-day moves were -0.9%, -3.9%, +2.6% and +5.3%, newest first. The July report on 2026-08-19 produced a small decline despite a 40% sales gain. The average absolute move is 3.2%, so the market did not treat any of these reports as a surprise; it had already priced the acceleration. Small reactions to big numbers are the fingerprint of a story everyone knows.
Short interest is 1.8% of float, and the quantitative score in our data has moved from C to B over the last several weeks. Neither is a signal by itself. What they say together is that nobody is fighting the recovery and nobody has yet found a reason to abandon it. The dividend adds a small cushion: 1.11% yield, $4.18 paid over the last twelve months. You can look at the valuation history and the financial statements to check any figure above.
| Metric | Value | Context |
|---|---|---|
| Price (approx.) | $375.72 | 52-week range $221 to $445 |
| P/E (TTM) | 44.6x | Five-year average 48.7x |
| Price-to-sales | 12.6x | Five-year average 10.3x |
| Analyst ratings | 95% buy, 5% hold | 21 analysts; average target $482 |
| Dividend yield | 1.11% |
What would make me wrong
Three conditions. The first is a sequential decline. If revenue falls quarter over quarter while the year-over-year comparison stays above 30%, the acceleration story is over even though the headline still looks strong. The comparison base gets harder each quarter, since the quarters a year earlier were already recovering, so year-over-year growth has to slow eventually. What matters is whether sequential growth stays positive while it does.
Second, margin give-back. The 61.5% gross margin is above last year’s, but it is still below the 65.9% the company earned in fiscal 2020 and the 64.0% of fiscal 2023. If price concessions or a heavier mix of lower-margin industrial parts pull it back below 60%, the drop-through that justifies today’s multiple weakens.
The third is duration. Companies that sell into cyclical end markets tend to see re-ordering waves that overshoot, and then a second inventory correction. I cannot see channel inventory from the data I have, so I treat this as unknown, and I will not lean on it in either direction. What I can say is that fiscal 2024’s 23% drop came only one year after a record, which is a reminder of how quickly the cycle turns in this industry.
What I am not covering: the competitive position against other analog suppliers, the capital spending plans, and the tariff environment. Each matters, and none can be judged from the price-and-financials data I use here. If you want the method behind how I read fund flows into names like this one, I laid it out here.
A gross-margin floor I would hold it to
At $376 you are paying 27.9 times forward earnings for a business whose profit is growing four times faster than its sales, but whose sales growth is at its most flattering. I would accept that price if the next report shows two things: revenue above $4.02 billion, so the sequential step continues, and gross margin at or above 61.5%. A print with sales up and margin down would change my view faster than a print with slower growth and firmer margin.
Gavin Thorne has invested in U.S. stocks for six years and previously worked at a large publicly traded internet company. He writes about income-oriented strategies, including cash-secured puts, and about how he reads company data. This article reflects his personal research process and is for informational purposes only. It does not constitute investment advice.
Sources: Dividends (SEC Investor.gov glossary) (https://www.investor.gov/introduction-investing/investing-basics/glossary/dividend) · Dividends tax topic (IRS) (https://www.irs.gov/taxtopics/tc404)