
In the year KLA’s revenue fell 6.5%, from $10.50 billion to $9.81 billion, its gross margin went up. It moved from 59.8% to 60.0%, a rise of a fraction of a point, but a rise. Chip-equipment makers are supposed to lose pricing power when customers stop ordering. KLA did not.
That single data point is the reason KLA Corp is one of the most argued-about stocks in semiconductors. The company makes the inspection and process-control tools that find defects on wafers and masks, and Morningstar rates the moat as wide, citing intangible assets and switching costs. I do not dispute the business. My argument is narrower: the moat is priced, the price already assumes earnings roughly half again as large as the last twelve months, and the recent tape suggests that buyers have started to ask for proof.
What the numbers say about the moat
Start with revenue. Fiscal 2023 closed at $10.50 billion, fiscal 2024 fell to $9.81 billion, fiscal 2025 jumped 23.9% to $12.16 billion, and fiscal 2026 added another 11.7% to reach $13.58 billion. A cyclical business, in other words, but one that lost only about one dollar in fifteen at the bottom.
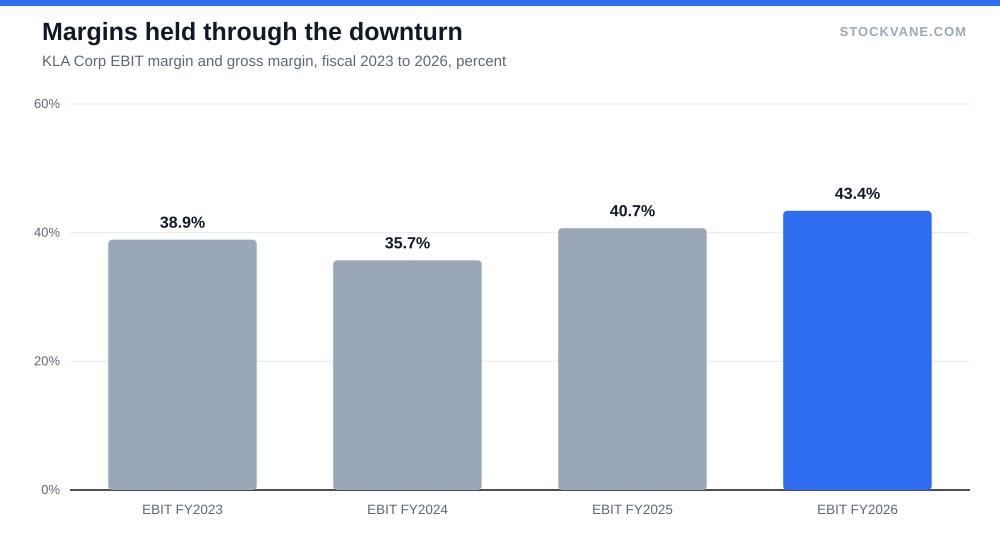
The profit lines are where the moat shows. EBIT margin, as the database calculates it, dipped to 35.7% in the down year and then climbed to 43.4% in fiscal 2026. Gross margin barely moved across the whole cycle, staying between 59.8% and 61.3%. A supplier facing real price competition sees that line swing by several points. Diluted earnings per share went from $2.03 to $3.04 to $3.66, so the earnings recovery has been much steeper than the revenue recovery.
Some of the profit growth came from restraint. Research and development spending was $1.28 billion in fiscal 2024 and $1.53 billion in fiscal 2026, so it rose in dollars but shrank as a share of sales, from 13.0% to 11.3%. That is the pattern of a business whose customers keep buying the newest generation of tools regardless of how much the vendor spends to defend the position.
The margin path is easier to see on its own.
Why inspection is a different business from etch and deposition
Segment data helps here. Semiconductor process control accounted for $12.24 billion, or 90.2% of fiscal 2026 revenue. The rest is mostly printed circuit board and component inspection. There is no large second engine to hide behind, and I read that as a feature: the company is a pure expression of one idea, that finding defects early costs less than finding them late.
The idea holds up because yield is the number a chipmaker cares about most. When a fab is learning a new process node, every inspection tool on the line shortens the time until the process works. Buyers pay for the tool with the best defect-capture record and then keep buying it, because the recipes, software and service contracts are built around one vendor. That is the switching-cost argument in Morningstar’s note, and it is the reason margins hold in a downturn. It is also why ASML gets discussed in the same breath, a company we looked at in our piece on ASML and the difficulty of timing it. Both are excellent businesses whose stocks are much harder to own than the businesses are to admire.
What the market has been saying since October
Here is the part that does not fit a clean moat story. KLA has now grown revenue year on year in each of its last four quarters, by 13.0%, 7.2%, 11.5% and 15.2%, with the latest quarter reaching $3.66 billion and net profit of $1.36 billion. Yet the stock’s move on the four report days in that stretch was -1.7%, -15.2%, -3.6% and -10.8%, according to StockVane’s earnings table. Compounded, that is about 28% lost across four prints in which the company kept growing.
I would not build a causal story from that. StockVane’s news feed for the name shows analyst rating and target changes but nothing that explains any single move, and I will not invent an explanation. The pattern says something narrower: when a stock trades at a large premium, good numbers are the expected outcome, and only numbers well above expectations get rewarded.
The premium is visible in the multiples. At $176.99 the shares trade at 48.4 times trailing earnings, against a five-year average of 29.4 in StockVane’s valuation table, which puts the current reading at the 90th percentile of its own history. On sales the gap is wider: 16.3 times against a five-year average of 9.4. Neither of those says the stock is wrong. They say the market pays much more for each dollar of KLA revenue than it did in a typical year of the last five.
The forward multiple carries the argument
The forward P/E in the same table is 31.3. Divide the price by it and you get implied forward earnings of about $5.66 a share, against trailing diluted EPS of $3.66. I read this as analysts expecting earnings roughly 50% above the latest twelve months, though the database does not say which period the forward figure covers, so treat the size of the jump as approximate.
Our look at why Alphabet’s low multiple was the whole thesis is the mirror image: there the price asked for little, here it asks for a lot. If the forecast arrives, the stock at $176.99 is not expensive. If growth simply continues at the fiscal 2026 pace of 11.7% in revenue and 20% in EPS, the forward multiple is optimistic by a wide margin. That is the whole disagreement, and it is a numbers disagreement, not a moat one. Investors who own KLA for its competitive position and investors who worry about the price are both right about the facts. They differ on how fast the next twelve months compound.
For a fair-value cross-check, Morningstar’s fair value estimate in the database is $175, with 3 stars, which is within about 1% of the current price. On that view the shares are fairly priced, not cheap. Sell-side analysts are more generous: 19 cover the stock, 74% rate it a buy, and the average target of $246 sits 39% above the price. The lowest target is $195, still 10% higher, and the highest is $325. A range with nobody below the current price usually tells you that targets lag the tape more than they lead it.
| Fiscal year | Revenue | Revenue growth | Gross margin | EBIT margin | Diluted EPS |
|---|---|---|---|---|---|
| FY2023 | $10.50B | +13.9% | 59.8% | 38.9% | $2.42 |
| FY2024 | $9.81B | -6.5% | 60.0% | 35.7% | $2.03 |
| FY2025 | $12.16B | +23.9% | 60.9% | 40.7% | $3.04 |
| FY2026 | $13.58B | +11.7% | 61.3% | 43.4% | $3.66 |
The customer concentration nobody can diversify away
KLA sells to a short list of chipmakers, and its regional revenue tells you where they are. In fiscal 2026 China accounted for $4.05 billion, or 29.8% of revenue, Taiwan for 26.8% and Korea for 13.5%. Those three regions together make up about 70% of sales.
China is the risk that keeps a premium multiple honest. Export controls on advanced tools can change a customer’s ability to buy with one regulatory notice, and nothing in a company’s margin history predicts that. I do not know how much of that 29.8% is exposed to future restrictions, and the database does not say, so I would not pretend to size it. What I can say is that a stock priced for 31.3 times forward earnings has less room for a China-driven revenue miss than a stock at 20 times.
The second risk is timing. Inspection spending follows fab capital budgets, and fab budgets follow chipmakers’ confidence in demand two years out. The fiscal 2024 decline shows what a pause looks like: revenue down 6.5% and earnings per share down 16%. That is a mild dip for the industry, and the stock, which sits 42% below its 52-week high of $307.03 yet 81% above the low of $97.57, has been moving as if the next pause were on its way.
For readers who want the mechanics of judging a print like this, our guide to how to read an earnings report covers the line items I look at first: revenue against the year-ago quarter, margin against the prior quarter, and guidance against the consensus number. On KLA, the third is what has moved the stock.
What I am not covering
I have not looked at KLA’s backlog, its buyback history or its tax rate. The database does not give me order data I trust, and a valuation argument does not need them. I also have not compared the multiple with Lam Research or Applied Materials, since the valuation table’s industry average of 45.1 times earnings is a blended figure and I would rather not lean on it without knowing which companies it covers. Short interest is 2.25% of float as of the end of August, which is low and says traders are not positioned against the moat.
The growth rate that justifies the price
My call: KLA is a wide-moat business at roughly a fair price, and a fair price does not make a return. At $176.99, an owner needs the forward earnings estimate of about $5.66 to arrive, and a buyer waiting for a margin of safety would want either a price near the low end of the analyst range or evidence that growth is reaccelerating.
The next report is the test. If the calendar follows last year’s, it lands in late October, against a year-ago quarter of $3.21 billion. Revenue of about $3.59 billion or better would mean growth of at least 12%, and an EBIT margin holding above 43% would say the moat is still doing the work. Anything below both would put a 31.3 times forward multiple in front of a slowing top line, and the four report days since October show what the market has done with that combination before.
Financial disclaimer: The content on StockVane is for educational and informational purposes only and should not be construed as professional financial advice. Stock market investing involves risk of loss.
Sources: Dividends (SEC Investor.gov glossary) (https://www.investor.gov/introduction-investing/investing-basics/glossary/dividend) · Price-to-earnings ratio (SEC Investor.gov glossary) (https://www.investor.gov/introduction-investing/investing-basics/glossary/price-earnings-pe-ratio)