
On the three valuation gauges StockVane tracks for PepsiCo, price to earnings, price to book and price to sales, the stock sits at the 0th percentile of its own five-year range on all three. Not the 5th, not the 10th. The bottom. At $129.75 it is also just 0.2% above its 52-week low of $129.55.
Something is being priced in, and the usual name for it is GLP-1. The weight-loss injections have made investors ask whether a company selling salty snacks and sugary drinks faces a permanent drop in appetite. I take the fear seriously and cannot measure it from this database, which holds no data on prescriptions or on what patients buy. What the database does show is a company whose profits have been thinner and whose cash flow has been tighter than the headline debate admits, and that is where I think the real question sits.
My view: PepsiCo at this price is a reasonable value stock with a thin cushion, and the cushion is the cash flow, not the demand story. If the free cash flow that pays the dividend keeps sitting exactly on top of it, the stock will stay cheap for a reason, and the argument for changing how the company allocates capital gets louder.
Cheap against its own history and against its sector
Numbers first. The stock trades at 17.0 times trailing earnings in the quote snapshot, and 15.9 times on the forward figure in the valuation table. Its own five-year average is 26.2, and the industry average in the same table is 24.5. On sales the reading is 1.9 times against a five-year average of 2.5 and an industry figure of 3.3.
That is a discount to history and to peers at once. It is a real discount, though I would not call it a bargain by itself. A stock that has fallen 22% from a 52-week high of $166.41 is usually cheap for a reason, and the useful work is working out the reason.
Compare it with the other end of the staples aisle. Costco commands a multiple that we described in the Costco piece as software-like for a warehouse retailer. PepsiCo, with $93.92 billion of annual revenue, sits at roughly a third of that multiple. The market is telling you which staples it believes in, and it is not telling you kindly.
What the last fiscal year actually looked like
Fiscal 2025 revenue was $93.92 billion, up from $91.85 billion. That is growth of 2%. Operating profit rose to $13.49 billion from $12.92 billion, so the operating margin edged up from 14.1% to 14.4%.
Then the picture breaks. Net profit fell 14%, from $9.63 billion to $8.29 billion, and diluted EPS from $6.95 to $6.00. Operating profit went up while net profit went down, which means the loss happened below the operating line, in charges, interest or taxes. The database does not itemize them, so I will not guess. It is one more reason to read the filing, not the ticker.
One caution on margins. StockVane’s database also carries an EBIT margin figure for PepsiCo that fell from 14.0% to 12.1% over the same year, which does not match operating profit divided by revenue. The two are computed on different bases. I use operating profit divided by revenue throughout, since I can reproduce it.
The recovery is visible in the most recent quarters. In the quarter ended June 2026, revenue was $24.18 billion against $22.73 billion a year earlier, operating profit was $4.02 billion against $3.65 billion, and net profit was $3.00 billion against $1.28 billion. Net profit over the last four quarters adds up to $10.52 billion, above the fiscal 2025 total of $8.29 billion. The year-ago comparison was weak, which flatters the jump, so I would not extrapolate it.
| Fiscal year | Revenue | Growth | Operating profit | Operating margin | Net profit | Diluted EPS |
|---|---|---|---|---|---|---|
| FY2021 | $79.47B | +12.9% | $11.16B | 14.0% | $7.68B | $5.49 |
| FY2022 | $86.39B | +8.7% | $11.36B | 13.1% | $8.98B | $6.42 |
| FY2023 | $91.47B | +5.9% | $12.91B | 14.1% | $9.15B | $6.56 |
| FY2024 | $91.85B | +0.4% | $12.92B | 14.1% | $9.63B | $6.95 |
| FY2025 | $93.92B | +2.3% | $13.49B | 14.4% | $8.29B | $6.00 |
The dividend is covered, just barely
This is the number I would put at the top of the page. In fiscal 2025 PepsiCo generated $7.67 billion of free cash flow and paid $7.64 billion in dividends. Cover was 1.00 times. A year earlier it was 0.99 times, with $7.19 billion of free cash flow against $7.23 billion paid.
At 1.00 times, nothing is left over for buybacks, debt paydown or a bad year. The dividend is not in danger while operating cash flow holds near $12.1 billion, but it is also true that the payout is funded only because capital spending was cut, from $5.32 billion to $4.42 billion. Operating cash flow itself slipped from $12.51 billion to $12.09 billion. Free cash flow rose only because the company spent less on plants and equipment.
The yield is 4.43% on the snapshot, and the quarterly dividend was raised about 4%, from $1.4225 to $1.48. A company that raises its payout while cover sits at 1.0x is making a bet on cash flow growth. I understand the bet. I would not describe it as conservative.
GLP-1: what the segment mix says
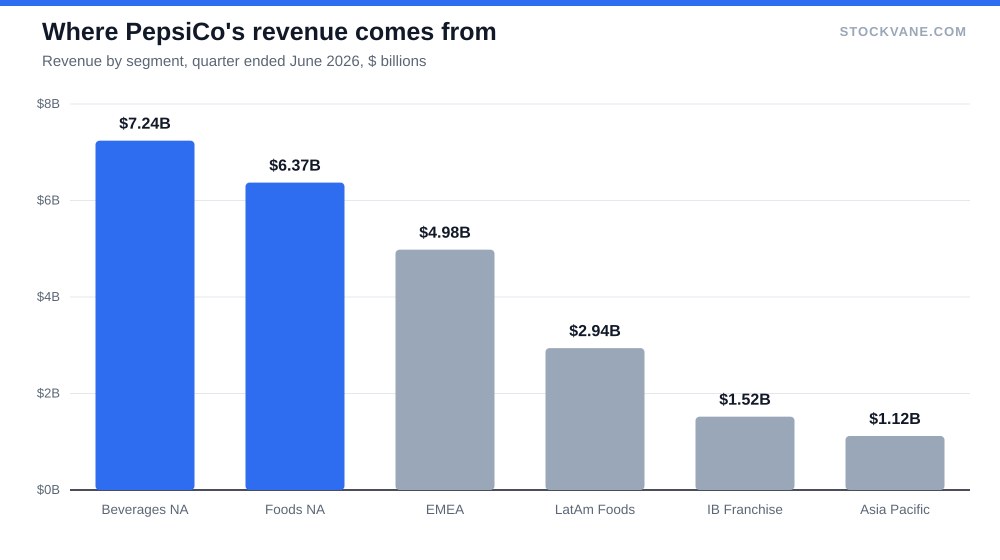
Here is the part of the demand argument I can test. In the June 2026 quarter, PepsiCo Beverages North America contributed $7.24 billion, or 30.0% of revenue, and PepsiCo Foods North America $6.37 billion, or 26.3%. Together, North America is 56.3% of the company. Europe, the Middle East and Africa adds 20.6%.
If GLP-1 adoption is concentrated in the United States, as I understand it though the database cannot confirm, then more than half of PepsiCo’s revenue faces the exposure and the rest faces little of it. That cuts both ways. The fear is not misplaced, and it is also not global. Compare it with our work on the obesity drug market and how forecasts keep growing: if that forecast is right, the exposed share of revenue will keep rising for years, and the question becomes how much of the 56% is at risk, which no chart here can answer.
The counter-case, and I want to give it its due, is that revenue growth continued through the period when these drugs were spreading fastest. Quarterly revenue rose 6.4% year on year in the latest quarter. If snack and drink demand were collapsing, I would expect to see it here first. I do not see it yet.
The structural argument nobody is making loudly
The title of this piece mentions an activist case, so let me be clear about what I mean. I have no data on any campaign at PepsiCo, and the StockVane news feed for the ticker shows analyst rating changes, not a filing from an outside investor. What I am describing is the argument any outside owner would make from the same numbers.
It runs like this. Beverages and foods are run inside one company, with North American beverages at 30.0% of revenue and North American foods at 26.3%. The stock trades at a discount to history. Free cash flow only just covers the dividend. Capital spending has been cut to protect that cover. An owner looking at those four facts would ask whether the businesses would be worth more apart, or whether capital spending should fall further to lift returns. I do not know the answer, and separating two businesses that share distribution costs is harder than it sounds. But the questions are legitimate at a stock that has been pushed to its low.
What the market and the models think
Analyst opinion is lukewarm: 16 analysts cover the stock, 38% rate it a buy and 62% a hold, with none at sell. Targets run from $140 to $183, and the average of $159 is 23% above the price. Even the lowest target is 8% higher. Morningstar rates the stock 4 stars with a fair value of $169, about 30% above the price, and describes the moat as wide.
StockVane’s own quant grade tells a different story. It fell from a B on September 8 to a D on September 20, with a score of 24. Quant grades chase price and momentum, so a stock making new lows will score badly, and I would not read the D as a verdict on the business. It is a fair summary of the tape: nobody wants to buy this until the report.
Cheap stocks earn their discounts, a point we made about Alphabet’s low multiple, and the quant grade fits that pattern. Short interest is 1.56% of float, which is low. Nobody is betting on a collapse. They are simply waiting.
What I am not covering
I have not modeled volume versus price and mix, which is the split that actually decides whether GLP-1 is denting demand. The database does not carry it. I have also skipped pricing pressure from private-label competition and the tax and charge items behind fiscal 2025’s net profit decline, since none of them can be pulled from the data I trust.
What I would need from October 8
PepsiCo reports on October 8. The last four report days, latest first, were down 3.3%, then up 2.3%, 4.9% and 4.2%, so the stock has usually held up on prints, and that is a low bar at a 52-week low. I would look at two lines.
First, revenue. The year-ago quarter was $23.94 billion, so growth of 6%, matching the last quarter, means about $25.37 billion. Second, operating profit against the year-ago $3.70 billion. If revenue hits that and operating profit reaches or exceeds $3.70 billion, the GLP-1 story is not yet visible in the numbers and the 4.43% yield is being paid for. If revenue comes in under about $24.7 billion, or operating profit falls, the argument for stepping in disappears and the one for restructuring gets louder.
Financial disclaimer: The content on StockVane is for educational and informational purposes only and should not be construed as professional financial advice. Stock market investing involves risk of loss.
Sources: Dividends (SEC Investor.gov glossary) (https://www.investor.gov/introduction-investing/investing-basics/glossary/dividend) · Dividends tax topic (IRS) (https://www.irs.gov/taxtopics/tc404)