
United Parcel Service earned $6.56 a share over the last twelve months. It paid $6.56 a share in dividends over the same stretch. To the cent, the payout ratio is 100%, and at a yield of 6.62% the stock ranks third among the highest yields we track. Whether that dividend is safe depends on which line of the financial statements you decide to trust.
The wider list is more telling. Of the 300 stocks in StockVane’s coverage, 244 pay a dividend, 59 yield 3% or more, and 16 yield 5% or more. My argument is that a yield tells you only what the market charges for the promise. Two separate tests tell you whether the company can afford to keep it: the payout ratio, which compares the dividend with trailing earnings per share, and cash cover, which compares free cash flow with the cash the company actually paid out. Read together they split this list cleanly. Read alone, each one misleads.
What each test can and cannot see
The payout ratio here is the trailing twelve-month dividend divided by trailing earnings per share, both from the StockVane quote snapshot on September 18. Above 100% means the company paid out more than it earned. The catch is that earnings are an accounting number. Depreciation, impairments and one-time charges all move it, and none of them moves the bank balance the same way.
Cash cover uses the latest annual cash flow statement. It is free cash flow divided by cash dividends paid, so a reading of 1.00x means the business generated exactly what it paid out. That figure is for fiscal 2025, which makes it up to nine months older than the earnings figure. I will flag where the timing matters. Two more caveats. Petrobras appears twice because both share classes qualify, so the 59 lines are 58 companies. And for banks and utilities I show no cash cover at all, for reasons covered further down.
Here are the twenty highest yields with both tests side by side. Read the two right-hand columns against each other and not one at a time.
| Stock | Dividend yield | Payout ratio (trailing EPS) | Cash cover (FCF / dividends) | Read |
|---|---|---|---|---|
| Itau Unibanco (ITUB) | 7.30% | 77% | n/m | Stretched |
| MPLX LP (MPLX) | 7.04% | 87% | 1.02x | Stretched |
| United Parcel Service (UPS) | 6.62% | 100% | 0.88x | Stretched |
| Progressive (PGR) | 6.51% | 72% | 5.99x | Moderate |
| Energy Transfer (ET) | 6.32% | 110% | 0.81x | Above 100% |
| Pfizer (PFE) | 6.22% | 126% | 0.93x | Above 100% |
| Petroleo Brasileiro SA Petrobras (PBR.A) | 6.12% | 38% | 2.04x | Comfortable |
| Altria (MO) | 6.10% | 103% | 1.30x | Above 100% |
| British American Tobacco (BTI) | 5.84% | 70% | 1.08x | Moderate |
| Verizon (VZ) | 5.81% | 69% | 1.71x | Moderate |
| Comcast (CMCSA) | 5.80% | 24% | 3.93x | Comfortable |
| Enterprise Products (EPD) | 5.63% | 82% | 0.63x | Stretched |
| Vale SA (VALE) | 5.59% | 145% | 0.78x | Above 100% |
| Sanofi (SNY) | 5.57% | 65% | 1.51x | Moderate |
| Enbridge (ENB) | 5.53% | 117% | 0.36x | Above 100% |
| Petroleo Brasileiro SA Petrobras (PBR) | 5.53% | 38% | 2.04x | Comfortable |
| NatWest (NWG) | 4.69% | 49% | n/m | Comfortable |
| Honeywell (HON) | 4.55% | 64% | 1.82x | Moderate |
| ONEOK Inc (OKE) | 4.49% | 77% | 0.95x | Stretched |
| BP PLC (BP) | 4.48% | n/m | 2.23x | EPS near zero |
Few names in the top twenty look comfortable on both tests. Comcast is the clearest, with a 24% payout and cash cover of 3.93x. Pipelines crowd the stretched end. The two names with the highest yields, Itau Unibanco and MPLX, sit at payouts of 77% and 87%, which shows that a top-of-the-list yield does not by itself signal trouble.
How the 59 split
I sorted all 59 into five buckets by payout ratio. The middle two buckets hold most of the list. Only 11 pay out less than half of what they earn, while 13 pay out more than they earn.
That 13 includes BP, and BP deserves an explanation. Its trailing earnings per share are $0.02 against a dividend of $2.00, which produces a payout ratio near 9,985%. That number is arithmetic on a near-zero denominator, and I would not read it as a warning. The same company generated free cash flow of $11.3 billion against $5.1 billion of dividends, a cash cover of 2.23x. If I had shown only the payout ratio, BP would look like the most dangerous dividend in the country. On the cash test it looks fine. That one contrast is the best argument for using both.
The thirteen that pay out more than they earn
Of 42 companies where both tests are meaningful, 12 pay out more than 100% of earnings. The interesting question is how many of them are also short on cash. The grid below answers it.
| Payout ratio | Free cash flow covers the dividend | Free cash flow falls short |
|---|---|---|
| Above 100% | 5 | 7 |
| 75% to 100% | 6 | 3 |
| Below 75% | 19 | 2 |
Seven of the twelve fail both. Pfizer is the plainest case. It paid $1.72 against earnings of $1.36, a payout of 126%, and the cash flow statement shows the dividend costing about $0.7 billion more than the business produced. Vale (145% payout, 0.78x cover) fails by a wider margin. Brookfield Asset Management and Blackstone fail both as well, though asset managers report cash in ways that make free cash flow a poor guide, so I would not lean hard on their cover numbers.
The five that pass on cash are a different story. Altria paid out 103% of earnings, yet free cash flow covered its dividend 1.30 times over. When a mature cash generator pays out slightly more than earnings and still covers itself in cash, the gap can come from accounting charges that never touch cash. I read this as a company whose reported earnings understate its cash, though I cannot confirm what is inside the charge from our data. The Altria financials are worth a look before you decide.
Then there is UPS, which sits right on the line. Its payout is exactly 100%, and the cash test is worse: free cash flow of $4.76 billion against $5.40 billion of dividends leaves a gap near $0.6 billion. That is the one I would watch most closely, because both tests agree and the yield is the third highest on the list.
Pipelines: cash cover below 1.0x is often a choice
Seven pipeline names qualify, and they add up to a puzzle. Together they produced $21.4 billion of free cash flow against $30.9 billion of cash dividends, a combined cover of 69%. Only MPLX (1.02x) and Kinder Morgan (1.11x) cleared 1.0x. Enbridge was furthest behind at 0.36x, and its financials show why the number is so low: cash dividends of $8.6 billion against free cash flow of $3.1 billion, in the company’s reporting currency.
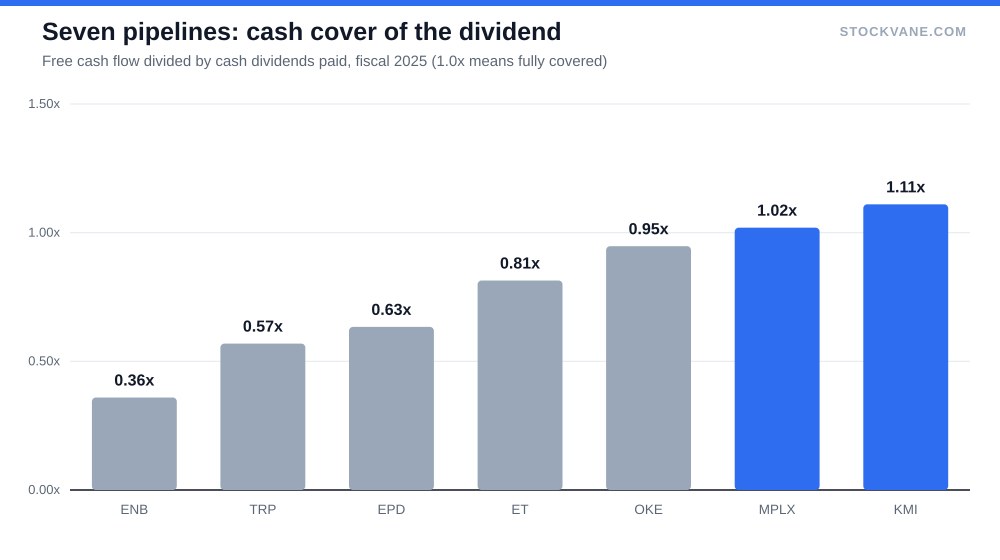
Before reading that chart as a distress signal, note what free cash flow means for this industry. It is calculated after all capital spending, including the growth projects a pipeline company chooses to build. Management can cut that spending and the cover rises. Many partnerships report a separate measure called distributable cash flow that excludes growth spending, and I do not have it in our data. So a cover below 1.0x here means the payout is being funded partly by borrowing or by asset sales, which is sustainable for a while and not forever.
The counter-argument is fair and I take it seriously: pipeline revenue is largely contracted, so cash flows are steadier than most industries. That lowers the odds of a sudden cut. It does not remove the arithmetic. If cover stays below 1.0x for several years, the debt that funds the difference has to be refinanced, and interest costs come out of the same cash that supports the payout.
Where neither test works
Banks and utilities break the cash test in opposite ways. For a bank, operating cash flow includes movements in deposits and loans, which swing wildly and say little about earning power, so I rely on the payout ratio alone. The ten banks on this list run from 34% (Deutsche Bank) to 78% (Bank of Nova Scotia), and none pays out more than it earns. All five utilities show negative free cash flow, because regulated companies spend more on the grid each year than they generate and finance the difference with debt, by design. Their payouts, 57% to 77%, are moderate. For these two groups, I would look instead at debt levels and regulatory rate decisions, which this screen does not capture.
The fifteen that pass both
I set the bar at a payout under 75% and cash cover of 1.5x or better, and 16 names cleared it. That is sixteen lines and fifteen companies, since Petrobras counts twice. Comcast, AT&T, Verizon, Shell, Novartis, GlaxoSmithKline and Honeywell are among them. Progressive’s cover is the highest at 5.99x, though as an insurer it is another case where free cash flow is a loose measure.
A comfortable payout has a cost of its own. Comcast pays out 24% of earnings, yet the shares trade 29% below their 52-week high. Honeywell is 23% below its high and Accenture 36% below. A falling price lifts the yield without any change in the dividend, so some of these names pass the payout test partly because the yield is high for a reason the payout ratio cannot show: the market may expect earnings to fall. That is the limit of a backward-looking screen, and I have no evidence in this data either way.
Comfortable on earnings, tight on cash
Two names go the other direction. Rio Tinto pays 66% of earnings, and Novo Nordisk 50%, both unremarkable. Yet their cash cover is 0.73x and 0.56x. The gap most likely reflects heavy investment in a given year, and one year of capital spending does not make a dividend unsafe. It does mean the earnings test alone would have missed it, which is why I would put both names on a list to check next quarter, not on a list to avoid.
For a longer look at whether chasing yield is worth it at all, our earlier comparison of high dividend yield against dividend growth covers the trade-offs, and the same logic applies to this screen: a payout ratio tells you about the past twelve months.
What I would open first
Not the yields. I would begin with the names where the two tests disagree, because that is where a five-minute look at a cash flow statement changes the answer. Altria, Chevron, Mondelez, Eni and CME pay more than they earn but cover the payout in cash. Rio Tinto and Novo Nordisk go the other way.
The single name I would follow into its next report is UPS. If trailing earnings per share stays below $6.56 while free cash flow keeps trailing the $5.4 billion it pays out, both tests will be flagging the same thing, and a 6.6% yield will be describing a strained payout and not a generous company.
Financial disclaimer: The content on StockVane is for educational and informational purposes only and should not be construed as professional financial advice. Stock market investing involves risk of loss.
Sources: Dividends (SEC Investor.gov glossary) (https://www.investor.gov/introduction-investing/investing-basics/glossary/dividend) · Dividends tax topic (IRS) (https://www.irs.gov/taxtopics/tc404)