
The most bearish of the 28 analysts covering Oracle has a price target of $145. The stock closed on September 18 at $147.61. So the lowest target on the Street sits about 2% under the price, while the average, $254, sits 72% over it. Both figures describe the same company on the same day, and the distance between them is what this note is about.
Analysts publish a target for nearly every large stock, and nearly all of them sit above the price. Among the 203 stocks in StockVane’s coverage with at least 12 analysts, 197 carry an average target above the current price. Only 6 do not. With the sign almost always positive, the size of the gap is the only thing left to read. My argument is that a wide gap mostly measures how far a stock has fallen since the targets were set, which makes it a weaker signal about the future than it looks. Oracle and Moderna, at opposite ends of the ranking, show where the signal works and where it does not.
Ranking 203 stocks by target gap
I divided each stock’s average analyst target by its September 18 closing price and ranked all 203. The median gap is 20%. Anything above 40% is unusual, and 17 stocks clear it. At the other end, 15 stocks have less than 5% between price and target.
| Stock | Price | Average target | Target vs price | Analysts | Buy ratings | Below 52-week high |
|---|---|---|---|---|---|---|
| Oracle (ORCL) | $148 | $254 | +72% | 28 | 86% | -55% |
| Applovin (APP) | $308 | $517 | +68% | 21 | 81% | -59% |
| Alibaba (BABA) | $113 | $188 | +66% | 12 | 100% | -41% |
| CRH PLC (CRH) | $86 | $136 | +58% | 12 | 100% | -34% |
| Western Digital (WDC) | $441 | $695 | +57% | 17 | 76% | -45% |
| Applied Materials (AMAT) | $445 | $692 | +56% | 27 | 89% | -40% |
| Micron Technology (MU) | $1,016 | $1,566 | +54% | 29 | 97% | -19% |
| Howmet Aerospace (HWM) | $230 | $339 | +48% | 16 | 88% | -26% |
| Cadence Design Systems (CDNS) | $283 | $417 | +47% | 16 | 94% | -32% |
| Broadcom (AVGO) | $358 | $525 | +47% | 29 | 93% | -28% |
| Royal Caribbean (RCL) | $246 | $361 | +47% | 13 | 77% | -30% |
| Uber Technologies (UBER) | $70 | $104 | +47% | 31 | 90% | -31% |
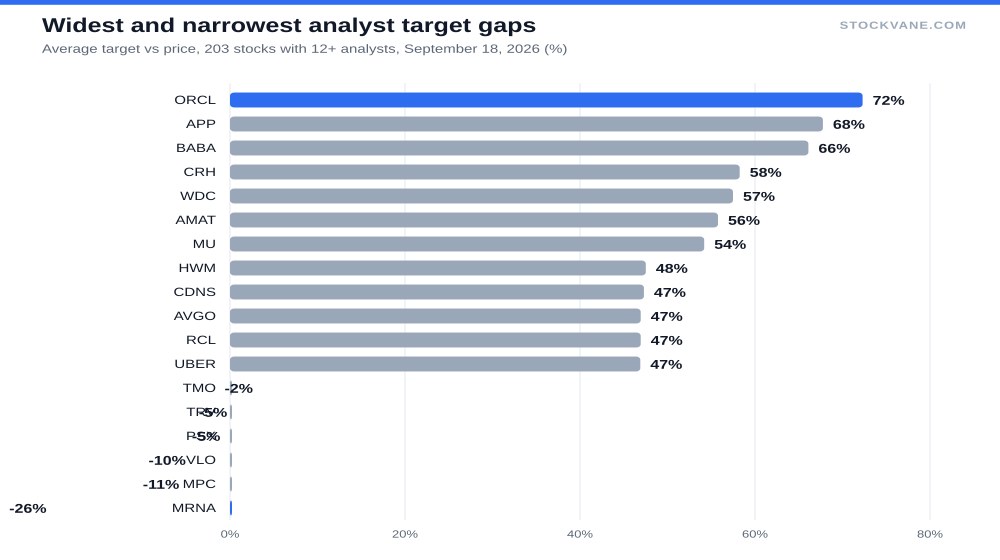
Every stock in that table trades below its 52-week high, from 19% below for Micron to 59% below for AppLovin. The average for the twelve is 36% under the high. Applied Materials is a good example: a 56% gap, 40% below its high, and a semiconductor cycle that our ASML piece argues is easy to admire and hard to time. Now look at the opposite end. The eight stocks with the smallest gaps, none above 3%, average 8% below their highs. The two ends of the list are mirror images.
The gap follows the fall
Splitting all 203 stocks into four equal groups by distance from the high makes the pattern hard to dismiss. The quarter furthest below their highs, 34% on average, has a median target gap of 35%. The quarter closest to their highs, 6% away on average, has a median gap of 10%. Across all 203 stocks the correlation between the two measures is -0.68.
For a cross-section of individual stocks that is a strong relationship, and the mechanism is not mysterious. Analysts revise targets in steps, usually after a report, and a stock can move 30% between two of those steps. A fall opens the gap without any analyst changing an opinion. A rally closes it the same way.
So the widest gap on the list does not prove analysts are unusually bullish. Partly it proves the stock is down. Whether the market overreacted or the targets simply have not caught up with a correct fall is what the gap cannot say. That is why I keep it as a screen for where to start reading, in the same spirit as the checklist in how I pick stocks, and never as a reason to buy.
Oracle: what a $254 target has to assume
Start with what is solid. Oracle’s fiscal 2026 revenue was $67.4 billion, up 17% from $57.4 billion a year earlier, and net income reached $17.1 billion. In the quarter reported on September 10, revenue was $19.3 billion, up 30% from a year before. Those are not the numbers of a struggling company, and our Oracle backlog piece covers the contracts behind them.
The stock is still 55% below its 52-week high of $326. So what does $254 require? On the $7.16 of forward earnings per share in our data, it is 35.5 times earnings. Oracle now trades at 23.6 times trailing earnings, against a five-year average of 34.7. The average analyst is therefore not forecasting a heroic year. The target assumes the multiple returns to roughly where it sat, on average, for the last five years.
That is a valuation call, and it can fail in two ways. One is growth. The 30% year-over-year quarter was only 1% above the prior quarter’s $19.2 billion, and the annual comparison gets harder from here. The other is margin: gross margin fell from 70.5% to 65.8% in fiscal 2026, while operating margin rose to 33%. If the second number stops rising, 35 times forward earnings is not on offer.
The range of targets is worth a look as well. The high is $400, 171% over the price. The low is $145. Of 28 analysts, 86% rate the stock a buy, and yet the most cautious one sits within a few dollars of the market. I find that more informative than the average. The debate is about how much upside there is, not about direction, and the skeptic is not calling for a fall. The AI-infrastructure spending that drives the bull case is laid out in our AI infrastructure guide.
Moderna: the target below the price
Moderna sits at the bottom of the ranking. The stock is at $154.04, and the average target of 13 analysts is $113, or 26% below. Only 23% of those analysts rate it a buy, 62% say hold and 15% say sell. The range is wide: the high target is $180, only 17% above the price, and the low is $60, which is 61% below it.
This is the fall mechanism run in reverse. The stock trades at $154.04 against a 52-week low of $22.28, a gain of 591% from the bottom, and it sits 13% under its high of $176.66. Targets set during the climb have lagged it. I read the negative gap as analysts refusing to chase, not as a forecast of a crash.
The business explains the reluctance. Revenue was $1.92 billion in fiscal 2025, down 40% from a year earlier, with an operating loss of $3.07 billion. The latest quarter brought in about $0.14 billion, of which COVID products supplied $91 million and the RSV vaccine $3 million. Against that, the stock trades at 25.8 times sales, against a five-year average of 5.7, which puts it in the 99th percentile of its own history. Short interest was 9.8% of the float at the end of August. I would not call any of that a thesis in either direction, but a stock priced at this multiple of sales needs the revenue line to turn, and analysts are not yet paying for it.
One more thing about the negative end. Six stocks have targets below the price. Phillips 66, Valero and Marathon Petroleum are three of them, with gaps of -5%, -10% and -11%, and all three trade within 1% of their highs. Here the targets are lagging a rally, the mirror of Oracle’s lagging a fall. I would not read anything about refining into it beyond that, since the database gives no news on the targets.
Where this argument could be wrong
The correlation of -0.68 leaves a third of the variation unexplained, so the fall is not the whole story. Analysts also know things about orders, contracts and margins that a price chart does not show. If the widest-gap stocks go on to beat the narrowest-gap ones over the next year, the gap carries real information and my reading is too cynical. I have no way to test that with one snapshot of targets, which is also why I am not ranking these stocks as picks.
Analyst targets also come from a small sample, and 12 to 30 people is not a crowd.
How I would use the gap before a trade
Three rules come out of this, and I apply them in this order. First, check the distance from the high. If the stock is 40% or more below it, discount the gap by most of its size, because that is the fall talking. Second, look at the lowest target rather than the average. A skeptic sitting at the price, as at Oracle, means the debate is about degree. Third, look for a stock where the gap is wide and the price is near its high. Micron, at 19% below its high with a 54% gap, is the closest thing on the list, and it is the one where I would take the analysts more seriously.
For Oracle the test is the next quarter. Revenue was $19.34 billion this time, up 1% on the prior quarter. If the next quarter is at least 5% above it, near $20.3 billion, the 30% annual growth rate has legs and $254 starts to look like a floor for the multiple instead of a stretch. If it is flat again, the lowest target of $145 is the number I would be watching, and it is only 2% below the price.
Gavin Thorne has invested in U.S. stocks for six years and previously worked at a large publicly traded internet company. He writes about income-oriented strategies, including cash-secured puts, and about how he reads company data. This article reflects his personal research process and is for informational purposes only. It does not constitute investment advice.
Sources: Price-to-earnings ratio (SEC Investor.gov glossary) (https://www.investor.gov/introduction-investing/investing-basics/glossary/price-earnings-pe-ratio) · Earnings reports (SEC Investor.gov glossary) (https://www.investor.gov/introduction-investing/investing-basics/glossary/earnings-report)