
Take 0.20% of $10,000 and you get $20. That is the extra cost a 0.25% fund charges over a 0.05% fund in the first year. Twenty years later the same 0.20-point difference has taken $1,409 out of the account, about 70 times that opening $20.
The arithmetic runs on compounding, and it runs in a direction most investors underweight. A fee is not a payment you make once a year and forget. It reduces the balance that earns next year’s return, so what you give up each year is the fee plus everything the fee would have earned. I ran the numbers on four cases below to see how big that second part gets, and where it stops mattering. My conclusion is narrower than the usual “fees are the only thing you control” line: the gap is real and easy to compute, but at the low end of the market it is smaller than most of the other decisions an investor makes.
The baseline: $10,000, seven percent, twenty years
Every figure in this post comes from one deliberately plain model. The fund earns 7% a year before costs, the expense ratio is subtracted from that return each year, and nothing else happens: no taxes, no trading costs, no contributions unless I say so. Seven percent is an assumption, not a forecast, and I test other rates further down. These are hypothetical calculations and not results from any actual fund.
Put $10,000 into a fund charging 0.05%. It earns 6.95% net and finishes year 20 at $38,337. Put the same $10,000 into a fund charging 0.25%. It earns 6.75% net and finishes at $36,928.
The difference is $1,409, or 3.7% of the cheaper fund’s ending balance. It builds unevenly, and the back half does most of the work: $130 after five years, $363 after ten, $759 after fifteen, $1,409 after twenty. The gap grows 3.9 times between years 10 and 20 even though the fee difference never moved.
The dollars the higher-cost fund actually collects in fees tell the same story from the other side. Adding up 0.25% of each year’s opening balance, that fund takes about $997 over the twenty years, against about $204 for the 0.05% fund. Roughly $793 of extra fees, yet the balance gap is $1,409. The difference between the two figures is the growth that money would have earned if it had stayed in the account.
What happens when you keep adding money
A lump sum is the simplest case and the least realistic. Most people buy ETFs through a paycheck. (Our post on buying Apple for retirement over eight years covers that steady-buyer habit with one stock, where no expense ratio applies but single-company risk does.) So I added $6,000 at the end of each year, which is $500 a month rounded to annual steps, to the same $10,000 start.
With the 0.05% fund the account reaches $282,971. With the 0.25% fund it reaches $276,290. The gap is $6,681, about 4.7 times the lump-sum gap, because each new contribution starts its own compounding under the higher fee. Total contributions in both cases are $130,000, so the fee difference here equals roughly 5.1% of everything the investor put in.
That figure is worth holding onto. A saver who contributes steadily for twenty years does not lose 0.20 points of return. The saver loses somewhere near 2.4% of the finished balance.
Fee tiers on the same $10,000
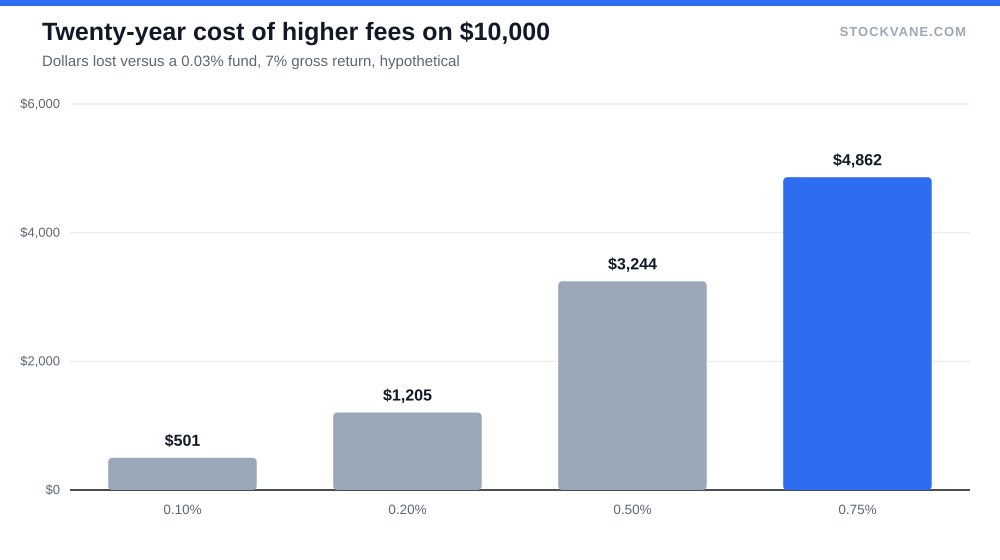
Expense ratios in the ETF market span a wide range, and 0.05% versus 0.25% is only one pair. The table shows five levels, from the lowest-cost broad index funds to the price of an actively managed or specialty fund, each on the same $10,000 over twenty years at a 7% gross return. The last column compares each with the 0.03% fund.
| Expense ratio | Net return | Value after 20 years | Cost versus the 0.03% fund |
|---|---|---|---|
| 0.03% | 6.97% | $38,480 | None |
| 0.10% | 6.90% | $37,980 | $501 (1.3%) |
| 0.20% | 6.80% | $37,276 | $1,205 (3.1%) |
| 0.50% | 6.50% | $35,236 | $3,244 (8.4%) |
| 0.75% | 6.25% | $33,619 | $4,862 (12.6%) |
Two features of the table matter. First, the cost is not linear in the way the ratios look. Moving from 0.03% to 0.10% costs $501, and moving from 0.10% to 0.20% costs another $704, but the jump from 0.20% to 0.75% costs $3,657. A fund at 0.75% ends with $33,619, which is 12.6% less than the 0.03% fund’s $38,480.
Second, the two lowest rows are nearly interchangeable. The gap between a 0.03% fund and a 0.10% fund is $501 after two decades on a $10,000 account. I would not switch funds, trigger a tax bill or give up a better index for that difference. Once a fund is under about 0.10%, the fee is a rounding error next to the choice of what the fund holds.
Put the same table the other way round and it becomes a hurdle. For a 0.75% fund to end up with the same $38,480 as the 0.03% fund, its manager would need a gross return of 7.72% a year against the 7.00% the cheaper fund earns, every year for two decades, with no year of lagging. Some active managers clear that bar in some periods. Very few clear it in a way an investor could have identified in advance, and that is the practical meaning of the numbers: the fee is certain, and the outperformance is a hope.
A bigger balance changes the dollars, not the percentage
The same 0.20-point gap on $250,000, again at 7% for twenty years, produces $958,420 against $923,204, a gap of $35,216. The percentage lost is the same 3.7%; only the currency size changes, by a factor of 25. That is why the fee question matters more in retirement accounts than in a starter account. On a small balance the difference is a nuisance. On a large one it is a car.
Does the assumed return change the answer?
It does, but less than people expect. If the gross return is 5% instead of 7%, the 0.20-point gap on $10,000 is $984. At 7% it is $1,409. At 9% it is $2,004. Higher returns make the fee gap larger in dollars, because there is more growth for the fee to interrupt, but the gap stays between about 3.7% and 3.6% of the ending value across that range.
The uncomfortable corollary is that expense ratios matter most in the scenarios where an investor is doing best. A 9% market makes the fee gap bigger in dollars. It is still the smaller number next to the growth itself, and I would not use that fact as an argument for ignoring cost. Income investors face a version of the same trade-off, and our comparison of high dividend yield and dividend growth covers how to weigh it.
Where this model breaks
The best argument against this analysis is that expense ratio is not the only cost of holding a fund, and sometimes not the largest. Three things the model leaves out:
The first is tracking difference. Two funds that follow the same index can deliver returns that differ by more or less than their expense ratios, because of how they hold securities, lend them out and handle cash. A fund with a 0.10% ratio can trail its index by 0.05% or by 0.15%.
The second is the trading spread. A thinly traded ETF can cost 0.10% or more each time you buy and sell, which overwhelms a 0.05-point fee saving for anyone who trades more than once or twice. For a buy-and-hold investor the spread is paid once. For someone rebalancing quarterly, it is paid four times a year.
The third is what the fund holds. Comparing a broad index fund at 0.05% with a specialty fund at 0.25% assumes they deliver the same gross return, which is the assumption that ends most cost debates. If the higher-fee fund holds something the cheaper one does not, the fee difference is not the right comparison. I am not covering that case, since the model has no way to say which portfolio earns more.
I also leave out taxes and the brokerage’s own charges. For a broker-side view of costs, our review of eToro’s fees for beginners is the place to see how much a trading platform can add on top of a fund’s ratio.
Where the fee stops mattering
The pattern from the calculations is simple. The first 0.10% of expense ratio is close to free. The next 0.15% starts to cost real money on a large balance. Beyond 0.50%, the fund has to beat a cheaper alternative by at least that much every year for twenty years just to break even, and a 0.75% fund on $10,000 has to earn an extra $4,862 of return over two decades to catch the 0.03% fund.
My rule follows from that. When two funds hold the same index and differ by under 0.10 points, I would choose on tracking difference and spread, not on the ratio. When the gap is 0.20 points or more on a balance above $100,000, I would switch, and I would do it in a tax-advantaged account first. Above 0.50%, I would want the fund to show me, in its own past returns after fees, why it is worth it.
Financial disclaimer: The content on StockVane is for educational and informational purposes only and should not be construed as professional financial advice. Stock market investing involves risk of loss.
Sources: Dividends (SEC Investor.gov glossary) (https://www.investor.gov/introduction-investing/investing-basics/glossary/dividend) · Dividends tax topic (IRS) (https://www.irs.gov/taxtopics/tc404)