
In 2022 the most expensive third of the stocks we track fell 16.3%. The cheapest third rose 7.0%. One year later the expensive third gained 51.8 and the cheap third 23.0. The style that was wrong by 23 points in 2022 was right by 29 points in 2023, and nobody who owned only one of them had a way to see the switch coming.
That reversal is my whole argument for holding both growth and value. It is not a claim that the two styles earn the same return, because in this data they did not. Growth won cumulatively, by a wide margin. My claim is narrower: the price of holding value alongside growth is visible and modest, and what it buys is a shallower worst year. Whether that trade is worth it depends on how you would behave after a 16% loss, and most of us behave worse than we expect.
How I built the two sides
I did not use fund returns. The StockVane database has no growth or value ETF in it, so I built proxies from what it does hold. From the 278 US stocks in our coverage with a positive trailing P/E below 300, I sorted by that P/E (the same multiple that separates the income names in our dividend yield versus dividend growth comparison) and took the cheapest 92 as the value group and the most expensive 92 as the growth group. The median P/E of the value group is about 14, and its priciest member sits at 18. The growth group has a median near 39, and its cheapest member trades at 29 times earnings. Returns are equal-weighted calendar-year price returns from December 31, 2020, through September 18, 2026.
Two limits matter, and I would rather state them than bury them. First, I sorted by today’s P/E, not the P/E at the start of each year. A stock that rose a lot is likelier to carry a high P/E now, so the growth group is flattered by hindsight. Second, these are price returns on individual stocks, not fund returns with dividends, and the value group pays more in dividends than the growth group does. The direction of the year-by-year pattern is more trustworthy than the size of any one number.
| Period | Value third | Growth third | Growth minus value (pts) | 50/50 blend |
|---|---|---|---|---|
| 2021 | 27.3% | 34.8% | +7.5 | 31.1% |
| 2022 | 7.0% | -16.3% | -23.3 | -4.7% |
| 2023 | 23.0% | 51.8% | +28.8 | 37.4% |
| 2024 | 17.7% | 41.9% | +24.2 | 29.8% |
| 2025 | 33.7% | 33.9% | +0.2 | 33.8% |
| 2026 YTD | 19.4% | 32.8% | +13.5 | 26.1% |
| Compounded since 12/31/2020 | 215% | 332% | +117 | 276% |
The years the gap changed sign
Read the table across each row. Growth led in 2021, by 7.5 points. Then 2022 flipped it: value gained 7.0% while growth lost 16.3%, a gap of 23.3 points against growth. The next two years reversed that again, with growth ahead by 28.8 points in 2023 and 24.2 in 2024. In 2025 the two ended level, 33.9% for growth and 33.7% for value, a gap of 0.2 points.
Look at 2025 first, because it is the year that fits neither story. Value returned 33.7% in a calendar year, the best figure in the table for that group, and growth still matched it. Nothing in the arithmetic says one style has to lose for the other to win. Both can rise, and in 2025 both did.
2022 is the year that matters for this argument. An investor holding only the growth group would have seen 16.3% disappear, and it took the 51.8% rebound of 2023 to recover it. That sequence is hard to sit through and easy to describe afterward. A fifty-fifty blend of the two lost 4.7% in 2022 instead.
The pattern has an intuitive reading, and I flag it as my reading, not a tested cause. Cheap and expensive stocks respond differently when investors reprice future earnings. In a year when the discount rate on distant profits rises, the stocks priced for those distant profits fall furthest, and 2022 fits that description. When confidence returns, the same stocks recover fastest. The data here cannot prove the mechanism, and I have not tied any year to a specific news event. What it does show is the size of the swings, and that is enough to plan around.
What the blend gave up and what it kept
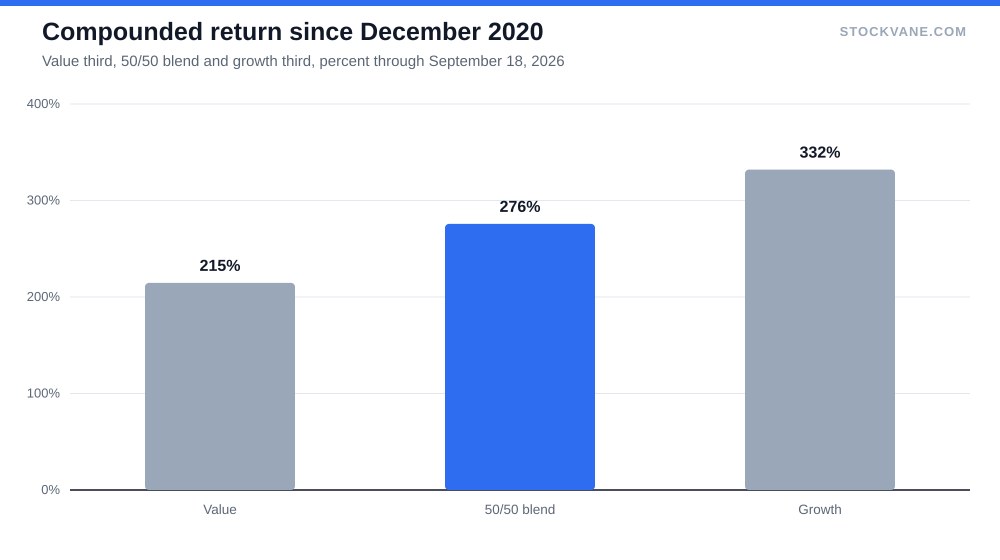
Here is the cost. Compounded from the end of 2020, the value group gained 215% through September 18, 2026. The growth group gained 332%. A blend of half each, rebalanced every December, gained 276%. So the blend trailed growth by 56 percentage points and beat value by 61. That is a real shortfall, and anyone who tells you diversification is free has not looked at a period like this one.
What the blend kept was the ride. The standard deviation of the six yearly returns was 21.6 points for growth, 14.0 for the blend and 8.3 for value. The worst blended year was the 4.7% loss of 2022. The worst growth year was 16.3%. Four times as deep, over one calendar year, is what growth-only investors accepted for the extra 56 points.
I read that as a fair trade for a household and a poor one for a fund manager measured against a growth index. Whether it is fair for you turns on one question: how much of your capital do you need in five years? If the answer is most of it, the shallower drawdown is worth more than the return you gave up.
The counter-case, taken seriously
The strongest objection is the one the numbers make for themselves. Growth beat value in 5 of these six periods and by a lot in three of them. If the leaders of the last five years keep leading, the blend is a drag you pay for nothing.
My response is that persistence in style leadership is exactly what the same data fails to show. The gap ran from 7.5 to -23.3 to 28.8 to 24.2 points in four consecutive years, and an investor who leaned on the previous year’s winner would have been wrong in 2022 by 23 points. Also, the hindsight problem noted above cuts against the growth result. Sorting on today’s P/E hands growth the stocks that already worked.
Look at what sits inside each group. JPMorgan at a record high is a story about paying roughly 15 times earnings for a bank, the kind of holding a value screen collects. Palantir sits at the other end, where the price only works if growth persists for years. A style is a bundle of stocks with a shared price tag and very different businesses.
Another opposing fact belongs on the table. Value is not just a defensive hedge. In 2021, 27.3% is a strong year, and in 2025 the group returned 33.7%. If you hold value only as insurance, you will keep selling it in the good years and buying it after the bad ones.
What I am not covering
I am not covering fund fees, taxes, or the actual construction rules behind any particular growth or value ETF, which differ enough that two funds with the same label can hold very different stocks. Some value funds hold a large financial sector and some hold more of it than the market does. A growth fund can hold the same megacap technology names as a broad index, which means an investor who owns both a broad-market fund and a growth fund may own far less diversification than the labels suggest.
A fund label is also not a guarantee of exposure. The largest names in the growth group by market value today include Apple, Taiwan Semiconductor, Broadcom, Eli Lilly and AMD, and the value group’s largest are Alphabet, Berkshire Hathaway and JPMorgan. Those lists overlap with what most broad-market funds already hold heavily. A stock like Palantir shows how far the far end goes: its valuation math only works if growth persists for years. If your core fund is a total-market index, part of your growth allocation is already there, and adding a growth fund on top makes the portfolio less balanced, not more.
That is why I would size the value side deliberately. If growth-style names already make up a large share of your index fund, the value sleeve has to be bigger than a fifty-fifty split to offset it. I would rather err toward too much value than too little, because the cost of doing so is the modest shortfall measured above, while the cost of the opposite error was a 16-point single-year loss.
The spread I would rebalance on
The mechanism matters more than the forecast, so here is how I would run it. Pick a target, say half growth and half value. Once a year, when the spread between the two has moved more than about 20 points, trim the winner and add to the laggard. In this data that trigger would have fired after 2022, 2023 and 2024, and after 2022 it would have pushed money toward growth at the bottom. A rule like that is dull and works better than judgment.
The number to watch is the annual gap. If it exceeds 20 points in either direction, rebalance. If it falls under 5, as it did in 2025, leave the portfolio alone.
Financial disclaimer: The content on StockVane is for educational and informational purposes only and should not be construed as professional financial advice. Stock market investing involves risk of loss.
Sources: Dividends (SEC Investor.gov glossary) (https://www.investor.gov/introduction-investing/investing-basics/glossary/dividend) · Dividends tax topic (IRS) (https://www.irs.gov/taxtopics/tc404)