
The SPDR S&P 500 ETF (SPY) closed on September 18 just 2.0% below its 52-week high. The median stock in StockVane’s coverage sat 12.4% below its own. Both numbers are accurate, and the distance between them is the story of this market.
To measure it, we took the 300 stocks we track and measured how far each one trades from its 52-week high, using the September 18 close. That universe includes both share classes of Alphabet and Berkshire Hathaway, and one convertible preferred security that our data treats as a stock, so treat the count as approximate at the edges. ETFs are excluded.
Our read: the market is not broad and it is not broken. It is sorted, and it is sorted by what a company sells much more than by how large it is. Energy, banks and a few health care names sit close to their highs. Semiconductor equipment, software and Chinese internet retail sit deep below them. The rest of this piece tries to show that with counts, and then to say where the evidence stops.
A long middle and a fat left tail
Only 17 of the 300 stocks, about 6%, sit within 3% of a 52-week high. Another 85 are 3% to 10% below, 109 are 10% to 20% below, 54 are 20% to 30% below, and 35 (12%) are at least 30% below.
The shape matters more than any single bucket. Two out of three stocks, 194 of them, sit between 3% and 20% below a high, which is what an ordinary, mildly choppy market looks like. The left tail is what pulls the simple average to 15.9% below, against a median of 12.4%. Four stocks are more than 50% down: Applovin (59%), Boston Scientific (59%), Intuit (57%) and Oracle (55%). Weighting by market value gives a middle figure of 13.5% below, so the index-style view is only a little better than the typical stock.
That is not a crash. It is a market in which a 12% pullback is normal and a 30% one is uncommon but not rare, and where the drawdowns are clustered.
Who is near the top
The 17 names within 3% of a high have a combined market value of about $7.2 trillion, and Apple is $4.9 trillion of that, or 68%. Strip Apple out and the other sixteen add up to $2.3 trillion. One of the seventeen, a Comcast convertible preferred, is not a common stock, so the count of true equities is sixteen.
What remains is old-economy and financial. Six are oil and gas companies or pipelines: TotalEnergies, Marathon Petroleum, Valero, Phillips 66, Enterprise Products and MPLX. Five are banks or insurers: Toronto-Dominion, Bank of Nova Scotia, ING, NatWest and Manulife. Four are health care: AbbVie, Thermo Fisher Scientific, Gilead Sciences and Takeda.
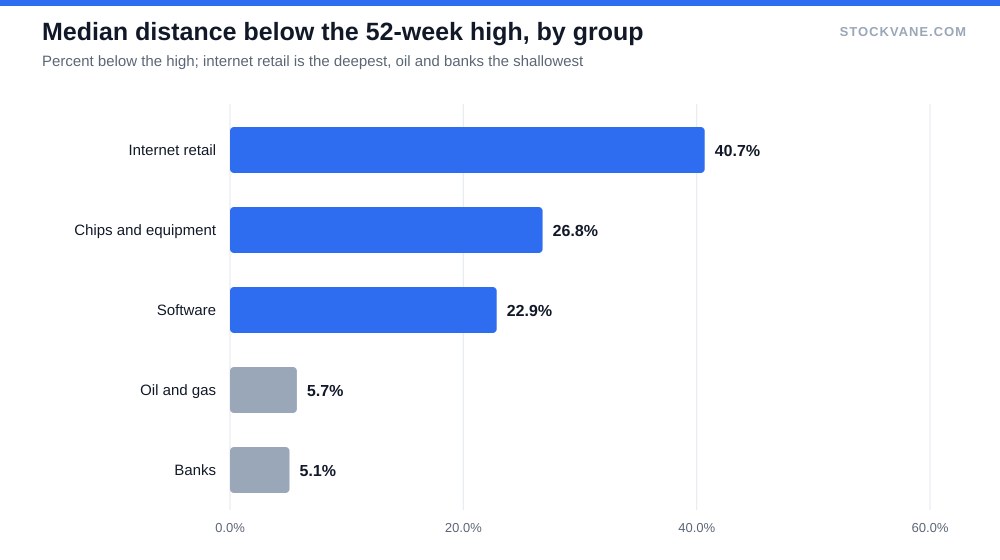
Across all 22 oil and gas names, the median stock is 5.7% below its high, and 5 sit inside the 3% band. Exxon Mobil’s forecast is a fair example of the group’s behavior: the stock is 6% below its high, close enough that no one is calling it broken. The refiners are the leaders, and they earned that position the hard way. Valero trades 172% above its 52-week low, Marathon 165% and Phillips 66 122%. Being near a high after that run tells us they have been rewarded, not that they are cheap.
Banks look similar. Of 18 banks, 3 are within 3% of a high, none is more than 30% down, and the median is 5.1% below. JPMorgan sits 5% under its peak. Nu Holdings, at 28% below, is the one real outlier.
The takeaway from the top of the list is less about any one sector than about what is missing. Not one of the seventeen is a software company, a chip designer or an internet platform. If you owned only the names at a 52-week high, you would own a portfolio with no software, semiconductor or internet-platform exposure at all, apart from Apple. That is a rotation a screen can see and a headline index can hide, and it is why the SPY reading of 2.0% below a high tells so little about the average holding.
| Industry group | Stocks | Median distance below 52-week high | Within 3% of a high | 30% or more below |
|---|---|---|---|---|
| Oil and gas | 22 | 5.7% | 5 | 0 |
| Banks | 18 | 5.1% | 3 | 0 |
| Software | 18 | 22.9% | 0 | 6 |
| Semiconductors and equipment | 16 | 26.8% | 0 | 6 |
| Internet retail | 5 | 40.7% | 0 | 4 |
| All stocks covered | 300 | 12.4% | 17 | 35 |
Where the damage sits
Semiconductors and chip equipment are the clearest concentration of pain. Our data has 16 names in the two industries, with a combined market value of about $9.3 trillion. Six of them are 30% or more below a high: KLA (42%), Applied Materials (40%), Arm (39%), Lam Research (34%), NXP Semiconductors (32%) and Qualcomm (31%). The median for the group is 26.8% below.
Yet averages hide a split inside the group. AMD is 4% below its high, TSMC 9%, and ASML 16%. If you want the wider argument for who sits where in that industry, our piece on semiconductor stocks worth owning beyond Nvidia covers it. Here the point is narrower. Chip stocks are not one trade. The ones tied to equipment and mobile have fallen the most, and the ones tied to foundry and the largest AI accelerators have fallen the least.
Software tells a similar story with a longer tail. Of 18 software names, 6 are down 30% or more and none is within 3% of a high. The median is 22.9% below. Intuit (57% below) and Oracle (55%) are the deepest. Microsoft (10% below) and Palo Alto Networks (9%) look like a different group. Oracle’s decline is the one we have written about most: its backlog says the next three years are booked, and the stock says prove it.
Internet retail is the smallest group and the worst. The median of 5 names is 40.7% below a high. Alibaba is 41% down, PDD 43%, Sea 48% and DoorDash 32%. Amazon, at 12% below, is the exception that keeps the group from being uniform.
One caution on all of this. Distance from a high measures the size of the run-up as well as the damage. Western Digital is 45% below its 52-week high and still 319% above its low, which means the high was a spike, not a plateau. Lam Research is 34% below its high and 131% above its low. Neither is a distressed stock in any ordinary sense. A stock that doubled and then gave back a third looks the same in this table as one that never recovered.
The lows are a different list
Thirty-three stocks trade within 10% of their 52-week low, and this list will surprise anyone who assumes the pain is all in technology.
| Stock | Below 52-week high | Above 52-week low | Market cap |
|---|---|---|---|
| American Tower Corp (AMT) | 10.4% | 8.7% | $0B |
| Aon PLC (AON) | 22.5% | 0.9% | $63B |
| Applovin (APP) | 58.7% | 3.5% | $103B |
| American Express (AXP) | 18.9% | 7.7% | $210B |
| Brookfield (BN) | 23.7% | 2.3% | $84B |
| Berkshire Hathaway-B (BRK.B) | 5.2% | 9.9% | $1,091B |
| Boston Scientific (BSX) | 59.0% | 2.7% | $63B |
| Cadence Design Systems (CDNS) | 32.1% | 7.7% | $78B |
| Comcast (CMCSA) | 29.0% | 6.9% | $81B |
| Costco (COST) | 18.2% | 6.5% | $397B |
Walmart is 20.8% below its high and only 8.8% above its low. The company got a lot of attention in our earlier note on how it trades like a software company, and I read the stock’s slide as the market pricing it less generously. PepsiCo, McDonald’s and Lowe’s are each within a fraction of a percent of their lows. Costco, Procter & Gamble, Home Depot and American Express are all inside 10%.
What connects them is not tech at all. It is consumer exposure, and mostly the defensive kind. I would be careful here, though. Berkshire Hathaway B appears on both lists. It is 5.2% below its high and 9.9% above its low, because its whole 52-week range is only about 16% wide. A near-low reading in a narrow range is a different animal from a near-low reading in a wide one.
Size does not explain it
Large caps are often blamed for masking the rest of the market, so we split the list by capitalization. The ten largest stocks have a median 13.0% below their highs, with one, Apple, inside the 3% band. Among the largest 100, the median is 12.0%, 6 are within 3% and 10 are 30% or more down. The smallest 100 of the 300 have a median of 12.0%.
Those numbers are nearly identical. So size explains little of the breadth gap; it is no tale of mega-caps rising while small names lag. The stocks that pulled ahead and the stocks that fell behind are spread across every size band, and what separates them is the industry.
What this does not tell us
We do not know why any of these moves happened, and we are not going to guess at causes from a price table. We have a single snapshot, a 52-week window and 300 names chosen by our coverage, not by an index committee. A different window would give a different answer, especially for stocks that have spiked.
The counter-case is also worth stating. If the sorted market is only a pause in a broader advance, the software and semiconductor groups could recover faster than the safe groups move higher. A market where 35 stocks are deeply down and some of them are up more than 100% from their lows already carries a lot of rebound in it.
What would show breadth returning
Two numbers, both from the same table. The first is the count within 3% of a high, now 17. If the S&P 500 makes a new high while that count stays under 20, the narrowness is intact. If it climbs past 35, about one in eight stocks, we would call the market broadening. The second is the median distance, now 12.4% below. A reading below 8% would mean the typical stock, not just the winners, has started to close the gap.
Financial disclaimer: The content on StockVane is for educational and informational purposes only and should not be construed as professional financial advice. Stock market investing involves risk of loss.
Sources: Market capitalization (SEC Investor.gov glossary) (https://www.investor.gov/introduction-investing/investing-basics/glossary/market-capitalization) · Earnings reports (SEC Investor.gov glossary) (https://www.investor.gov/introduction-investing/investing-basics/glossary/earnings-report)