
Every market wrap ends the same way. The Dow, the S&P 500, the Nasdaq, and then a last line about the Russell 2000, usually delivered as a mood reading on “the rest of the market.” The fund most people use to own that index is IWM, the iShares Russell 2000 ETF, and it changes hands about 8.8 billion dollars’ worth on a normal day.
That is a lot of money riding on a phrase almost nobody stops to define. My view, and the reason for this piece, is that the Russell 2000 is a measurement of a size band, not a curated list of good small companies, and that difference explains nearly everything odd about how IWM behaves. Buy it expecting a smaller S&P 500 and you will be surprised. Buy it knowing what it measures and it makes sense as a tool.
A ruler, not a filter
FTSE Russell starts with the 3,000 largest U.S.-listed companies by market value, which it calls the Russell 3000. The biggest 1,000 form the Russell 1000. The remaining 2,000 are the Russell 2000. Nobody looks at the quality of a business along the way. Rank by size, draw a line, done.
The S&P 500 works differently. A committee picks its members, and one of the entry tests is positive reported earnings, summed over the latest four quarters and positive in the most recent quarter as well. That single screen keeps out a whole category of company. How richly the benchmark itself is priced is a separate question, taken up in our look at whether the S&P 500 is overvalued. The Russell 2000 has no such gate, so the index carries plenty of businesses that have never made money and plenty that are burning cash to reach the day they might.
| Rule | S&P 500 | Russell 2000 |
|---|---|---|
| Who chooses members | Index committee, with eligibility tests | Mechanical rank by market value |
| Profit requirement | Positive earnings over four quarters and latest quarter | None |
| Size band | The largest U.S. companies | Ranks 1,001 to 3,000 of the Russell 3000 |
| Rebuild | Committee decisions through the year | Set annual reconstitution, historically in June |
| Typical member | Large, established, profitable | Small, mixed, some loss-making |
The two indexes cannot be swapped, and the table shows why. It proves the rules differ. It does not prove the Russell 2000 is worse, and there are years when the unscreened index has done better precisely because it owned early-stage winners before the S&P committee could add them.
You can get a feel for how much the earnings screen matters from our own database. StockVane covers 300 stocks, every one a large company, and the smallest is worth about $41 billion. Even in that group, 12 of the 300 report trailing earnings per share at or below zero, and 5 more have no figure. That is about 4% of a universe made of giants. Published counts for the Russell 2000 have put the loss-making share far higher, commonly around four in ten. I have not checked that against the current constituent list, so read it as an approximate outside figure and not as one of ours.
What the ruler does to returns
A size band has a built-in quirk. When a small company does well enough, it grows out of the band and gets promoted to the Russell 1000 at the next rebuild, which historically happens once a year in June. The index sells it on the way out. The vacancy is filled by companies that have shrunk from above, by fresh listings, and by others rising from the micro-cap tier. So the index keeps handing its winners to another index and keeps receiving its laggards.
I read that as a mild headwind that never shows up in a one-year chart. It also means that buying IWM is not the same as buying the average small business in America. It is a bet on the whole conveyor belt, including the part where the good ones leave.
The second quirk is the one traders feel. Small companies have thinner cash cushions and less pricing power, and a larger share of them borrow at floating rates than in the S&P 500. I have no figure for that share in our data, so I will not quote one. The direction is widely documented, and it is why IWM tends to react more sharply to shifts in expectations about interest rates. We took a longer look at where rates stand in our note on the September Fed meeting, and the same logic applies here: the index cares about the path of financing costs more than about any single decision.
Reading the last twelve months
The chart above compares how wide the past year’s trading range was for four ETFs. IWM went from a low of $226.60 to a high of $304.38, a spread of 34.3% from bottom to top. The S&P 500 fund, SPY, covered 24.2%. The Dow fund, DIA, covered 21.9%.
The result that spoils the tidy story is QQQ. The Nasdaq-100 fund (we rated its triple-speed cousin in the TQQQ breakdown) moved through 34.7%, a hair wider than IWM. So a small-cap index is not automatically the most volatile thing you can own. I would not build a rule out of a single year, and a different twelve months would likely reorder the bars. The fact that survives is a narrower one: IWM’s range was about ten points wider than the S&P 500’s, and that gap is the price of admission.
At about $284.10 as I write this, the fund sits 25.4% above its 52-week low and 6.7% below its high. SPY is 2.0% under its own peak. The gap of 4.7 percentage points says small caps still have a bit further to travel to make new highs, and a 7.1% climb from here would get IWM there. Whether that climb comes is a separate question, and the price history in front of us cannot answer it.
| Fund | Price | 52-week range | Above low | Below high | Turnover, $ billions |
|---|---|---|---|---|---|
| IWM (Russell 2000) | $284.10 | $227 to $304 | 25.4% | 6.7% | 8.8 |
| SPY (S&P 500) | $761.69 | $626 to $777 | 21.7% | 2.0% | 49.8 |
| QQQ (Nasdaq-100) | $721.45 | $555 to $748 | 30.0% | 3.5% | 34.9 |
| DIA (Dow Jones) | $515.88 | $447 to $545 | 15.3% | 5.4% | 1.4 |
Two limits on that table. The figures are approximate closing snapshots from September 18. And StockVane’s database holds prices and turnover for these four funds but no constituent list or fund-level earnings, which is why I have not tried to give you a P/E for the Russell 2000. Any number I quoted would come from memory, and I have made a habit of not doing that.
Where liquidity gets thin
Trading volume is a quieter piece of evidence. IWM turned over about $8.8 billion of stock in the session, on roughly 31.1 million shares. SPY turned over $49.8 billion, which is 5.6 times as much. QQQ did $34.9 billion and DIA $1.4 billion.
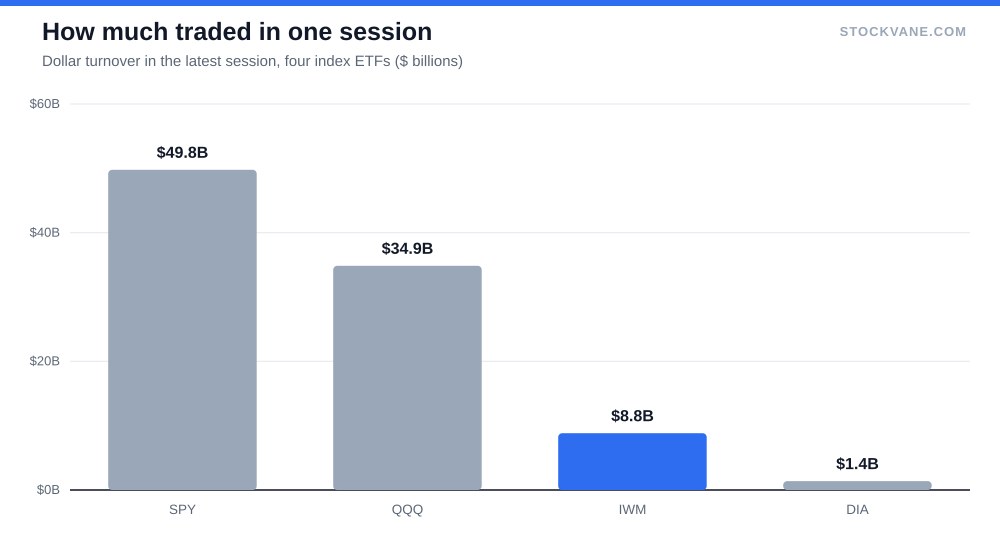
IWM is the deepest small-cap fund there is, and its trading costs are modest. But the shares of the companies inside it are far less liquid than those inside SPY, and on a bad day the fund’s price and the value of what it holds can drift apart. If you trade in size, use limit orders, and avoid the first and last few minutes of the session.
The rate argument, and the one I do not buy
The common case for small caps goes: cuts are coming, small companies borrow, their interest bills drop, their earnings rise, the index rallies. Each step is reasonable. The link I distrust is the timing. Markets price a rate cut long before it happens, and by the time the Fed acts, the index has often moved. Buying IWM on the day of a cut is often buying the news.
I also keep in mind our earlier piece on why the Fed keeps getting stuck between inflation and growth. If cuts get delayed or come with a weakening economy attached, small companies get hit from two sides: financing stays expensive and their customers spend less. A small-cap rally that depends on cuts alone is the version I would size smallest.
Here is what I am less sure about. I cannot tell you whether the earnings picture inside the index is improving, because our data does not include it. A fund that rose 25% off its low with weaker underlying profits would be a different story from one with rising profits, and from the outside I cannot separate the two. That uncertainty is the main reason this article stops at describing the fund and does not tell you to buy it.
Cost, alternatives and the S&P 600 question
IWM charges 0.19% a year according to the sponsor, a bit above the broadest funds and low for a small-cap strategy. Its closest substitutes deserve a mention because they answer the quality objection directly. The S&P SmallCap 600 applies the same positive-earnings screen the S&P 500 uses, and funds that track it, such as IJR, hold a less speculative set of companies. The two have traded the lead over the years, since owning the unprofitable names has been a source of return in some periods and of pain in others.
Neither is the right answer for everyone. If you want the purest measure of “small,” IWM is it, and I understand why traders prefer it. If your worry is owning companies that may not survive a credit squeeze, the screened index gets you closer to the small-cap idea without the tail.
Sizing it as a satellite, not a substitute
Small caps make sense next to a core position, sized so that a 30% year does not change what you do with the rest of the portfolio. That is a modest allocation, and if it feels too small to matter, I would question the position instead of raising the size. Ask why you own it. A view on rates is a coherent reason. A vague sense that small companies must be due is not.
I would also decide in advance what I am waiting for. My trigger is simple: IWM reclaiming its 52-week high near $304 on rising volume would tell me the market is willing to pay for smaller, more indebted companies again, and I would look at the position then. Until it clears that mark, I treat the fund as a rate expression with a size label.
The next thing I will watch is whether the S&P 500 and the Russell 2000 stop moving together. Right now the fund is 6.7% under its high against 2.0% for SPY. If that gap closes because IWM rises and not because SPY falls, the small-cap case gets stronger. If it closes because everything falls, nothing about the Russell 2000 has been proven at all.
Financial disclaimer: The content on StockVane is for educational and informational purposes only and should not be construed as professional financial advice. Stock market investing involves risk of loss.
Sources: Price-to-earnings ratio (SEC Investor.gov glossary) (https://www.investor.gov/introduction-investing/investing-basics/glossary/price-earnings-pe-ratio) · Federal Reserve monetary policy (https://www.federalreserve.gov/monetarypolicy.htm)