
Friday, September 18, was a different kind of session. The 300 stocks we cover changed hands for $791 billion, against a range of $348 billion to $461 billion on each of the previous twenty sessions and an average of $407 billion. It was the busiest day in that window by a wide margin, close to double a normal one.
Most of that jump has a calendar explanation. September 18 was the third Friday of the month, the day monthly and quarterly options and futures expire and index funds rebalance, and volume on those days runs well above the rest of the month. I would not read the level as a burst of conviction. What I would read is who stood out even against that inflated backdrop.
Two names did. Bloom Energy turned over $19.6 billion, which was 25.1% of its entire $78 billion market value, and its stock closed down 5.4%. Sandisk turned over $30.9 billion, 11.8% of its value, and rose 11.0%. My argument is that dollar volume alone ranks the giants and hides the story; the share of a company that trades in one day is the number that finds crowded positions, and on Friday that number pointed at two stocks whose rating scores are near the top of our scale.
Friday against a normal day
The ten busiest stocks accounted for $251 billion, or 32% of the day’s total, and the top twenty for $359 billion, 45%. Ten names out of 300 doing nearly a third of the trading is the usual shape of the market, and I do not think it is the interesting part.
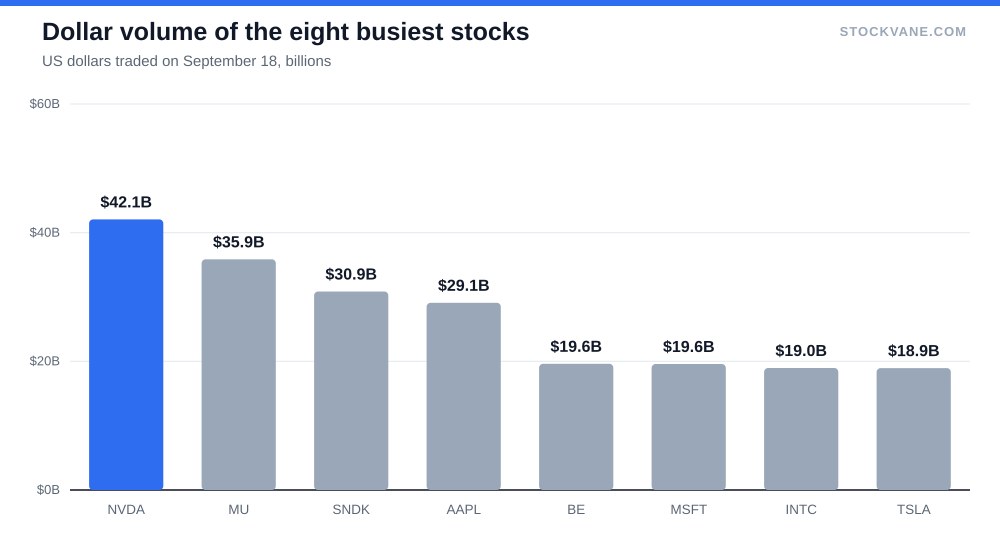
The comparison with each stock’s own history is. Nvidia’s $42.1 billion was 1.5 times its average of $28.5 billion over the prior twenty sessions. Sandisk ran at 1.9 times its own average of $16.5 billion, and Lumentum at 2.3 times. Bloom Energy ran at 6.2 times an average of $3.2 billion, and that average included one earlier day of $7.6 billion. Friday’s $19.6 billion was more than double even that peak.
The ten most traded by dollar value
| Stock | Dollar volume | Share of its market cap | Market cap | Day change |
|---|---|---|---|---|
| NVIDIA (NVDA) | $42.1B | 0.8% | $5.4T | +1.3% |
| Micron Technology (MU) | $35.9B | 3.1% | $1.1T | +3.9% |
| SanDisk (SNDK) | $30.9B | 11.8% | $262B | +11.0% |
| Apple (AAPL) | $29.1B | 0.6% | $4.9T | -0.3% |
| Bloom Energy (BE) | $19.6B | 25.1% | $78B | -5.4% |
| Microsoft (MSFT) | $19.6B | 0.5% | $3.7T | -0.8% |
| Intel (INTC) | $19.0B | 3.3% | $571B | -0.2% |
| Tesla (TSLA) | $18.9B | 1.3% | $1.4T | -0.5% |
| Meta Platforms (META) | $18.5B | 1.1% | $1.7T | -2.4% |
| Advanced Micro Devices (AMD) | $17.6B | 1.9% | $914B | +2.7% |
Nvidia, Micron and Sandisk sat at the top. Five of the ten (those three plus Intel and AMD) make chips or memory, which is a fact about where attention went on the day and not a forecast. Our earlier note on semiconductor stocks worth owning beyond Nvidia covers the fundamental side of that group.
Apple and Microsoft were in the top ten on sheer size. Apple turned over $29.1 billion and Microsoft $19.6 billion, yet each traded about half a percent of its value. Their stocks moved -0.3% and -0.8%. A mega-cap can post a huge dollar figure without much happening to it, because the denominator is enormous.
Turnover as a share of market value
Divide each stock’s dollar volume by its market cap and the ranking scrambles. The median stock in our coverage traded 1.1% of its value on Friday. Only 15 traded 3% or more, and 7 traded 5% or more.
Bloom Energy’s 25.1% is about 24 times that median. Nothing else in the coverage universe comes close, and only Sandisk and Lumentum (10.3%) cleared 10%. Nebius, Qualcomm, Coherent and Moderna all sat between 5% and 8%.
| Stock | Share of its market cap | Dollar volume | Market cap | Day change |
|---|---|---|---|---|
| Bloom Energy (BE) | 25.1% | $19.6B | $78B | -5.4% |
| SanDisk (SNDK) | 11.8% | $30.9B | $262B | +11.0% |
| Lumentum (LITE) | 10.3% | $8.6B | $84B | +4.2% |
| NEBIUS (NBIS) | 7.7% | $4.7B | $61B | +2.5% |
| Qualcomm (QCOM) | 5.2% | $9.7B | $187B | -5.8% |
| Coherent (COHR) | 5.1% | $3.2B | $62B | +7.2% |
| Moderna (MRNA) | 5.1% | $3.1B | $61B | -2.5% |
| Robinhood (HOOD) | 4.3% | $4.6B | $108B | +9.1% |
One caution on reading this table. A high turnover share tells you shares changed hands; it does not tell you whether buyers or sellers were the aggressors, since every share bought is also a share sold. Direction comes from the price change, and even that is ambiguous. Qualcomm traded 5.2% of its value and fell 5.8%, Robinhood rose 9.1% on a smaller share. Neither move can be explained from the volume figure, and the volume figure gives no reason for either.
Bloom Energy: the fullest room
Start with the stock’s own numbers. Bloom closed at $265.63 24.4% below its 52-week high of $351 and 333% above the low of $61. Trailing P/E is 345, the forward multiple is 80.6, and price to sales is 25.1 against a five-year average of 7.0.
The business supports part of that. Quarterly revenue reached $1.07 billion, up 166% from a year earlier and 42% from the prior quarter, on a single segment. Gross margin was 29.0% for fiscal 2025, up from 27.5%, but the EBIT margin for the year was still negative at -1.5%, so the profit story is thinner than the revenue story. Earnings history is volatile: the stock has moved an average of 13.0% after reports, though only -1.9% after the last one on July 28.
Then the positioning evidence. Short interest was 6.5% of the float as of August 31, with 1.6 days to cover, which is a meaningful short position for a company of this size, though one that could be closed out in under two days of trading. Analysts split 53% buy and 47% hold with none at sell. The average target of $279 is 5% above the price, the lowest target is $176, 34% below it, and the highest is $351. The quant rating moved from a C with a score of 59 on September 15 to an A at 96, the top of the scale, in the days after.
I read Friday as a crowded stock changing hands at a high price: a quarter of the company’s value in one session, a 5.4% decline, a rating that just turned to its best grade, and a valuation at 25 times sales. The opposing evidence is real. Revenue growth of 166% is not a story that fades in a day, and a quant model built on momentum and revisions would grade it well for that reason. If the growth holds for another two quarters, a 25% turnover day will look like a moment in a longer climb. If it slows, the price to sales multiple is where the pain is.
Sandisk: heavy, but with the crowd on its side
Sandisk is a cleaner picture. $30.9 billion of turnover on a $262 billion company is 11.8%, and the stock rose 11.0%. That is 1.9 times its own recent average, so it was active but not out of character. The shares are 24% below a 52-week high near $2,354 and the quant score is 100, an A.
The lesson from putting Bloom and Sandisk side by side is that the same headline number carried opposite signs. Bloom fell on record turnover and Sandisk rose on it. Turnover measures participation, and the price says who won that day. I would not build a trade on either without knowing whether the volume came from new holders or from expiring options, and the data we hold cannot separate them.
Sandisk and Bloom point in different directions, and that is worth a pause. A stock that rises 11% on twice its normal volume is being bid for by someone who is willing to pay up, while a stock that falls 5.4% on six times its normal volume is being handed from one set of owners to another at a lower price. Both can be true of the same week, and both are consistent with an A rating on the quant side, because that rating leans on growth and revisions rather than on how a single session traded.
The next ten names
Ranks 11 to 14 were Alphabet’s Class A shares at $16.8 billion, Broadcom at $15.7 billion, Amazon at $13.3 billion and Alphabet’s Class C shares at $11.8 billion. Add the two Alphabet lines and the company’s combined turnover was $28.6 billion, which would have placed it fifth, just behind Apple’s $29.1 billion. Share classes split the ranking, and I would keep that in mind before reading any single line of a dollar-volume list as the whole story on a company.
The turnover share for those names was low: 0.4% for Alphabet-A, 0.9% for Broadcom, 0.5% for Amazon. These are the stocks that anchor index funds, and index-fund rebalancing on an expiry Friday produces exactly this kind of large, low-percentage trade. I read the mega-cap end of the list as mostly mechanical and the small-cap end as mostly discretionary, though our data has no field that would let me prove it.
What this list does and does not tell us
The list does not tell us about intraday ranges, block trades or who was on the other side. It also uses one day, and one unusual one, so every ratio above would look different on a Tuesday in August. The Q4 tech stocks piece frames the group by valuation risk, and the AI infrastructure guide covers why capital has gathered in these names over the year, and both are better places to start than a single Friday.
The October 16 test
The next third Friday is October 16, and the useful question is simple: does Bloom Energy trade anywhere near a quarter of its value again? On Friday the stock was six times its own average. If turnover on the next expiry falls back below roughly $6 billion, about twice its twenty-session average, then September 18 was largely calendar. If it repeats above $15 billion with the stock falling again, something is being distributed, and the 96 rating score would be the wrong number to trust.
Financial disclaimer: The content on StockVane is for educational and informational purposes only and should not be construed as professional financial advice. Stock market investing involves risk of loss.
Sources: Price-to-earnings ratio (SEC Investor.gov glossary) (https://www.investor.gov/introduction-investing/investing-basics/glossary/price-earnings-pe-ratio) · Stock options tax topic (IRS) (https://www.irs.gov/taxtopics/tc427)