
Between fiscal 2022 and fiscal 2025, Exxon’s revenue fell 19%, from $398.7 billion to $323.9 billion. Over the same stretch net income fell 48%, from $57.6 billion to $29.8 billion. If the oil price had stopped mattering, the second number would not have tracked the first so closely, and it did.
So the title of this post needs a correction before the argument starts. Exxon is still an oil-price stock. What has changed is that management now decides a large share of what shareholders get from each barrel, and that is the part I can test with the filings in front of me. The test is mixed: returns to shareholders are large and reliable, but the cash behind them was thinner in 2025 than the payout implied.
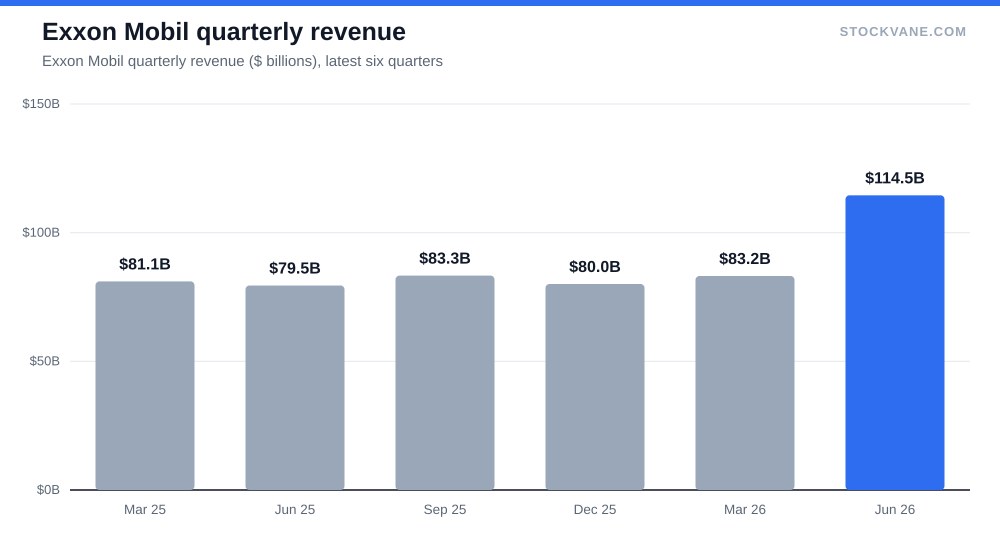
The oil price is still in the income statement
Look at the latest quarter first. Second-quarter revenue was $114.5 billion, up 44% from a year earlier and 38% from the first quarter. Net income for the quarter was $14.9 billion, against $7.4 billion a year before and $4.5 billion in the first quarter. One quarter earned about half of the $29.8 billion that all of fiscal 2025 produced.
The database has no oil-price series, so I cannot prove what drove that jump. I read it as commodity prices, because a 38% sequential revenue move in a business this large does not come from volumes, and Energy products alone booked $109.2 billion of segment revenue against a consolidated total of $114.5 billion after $45.2 billion of intersegment eliminations. That is an inference and I flag it as one.
Either way, the pattern matters for the discipline argument. Earnings are volatile: $57.6 billion in fiscal 2022, $37.4 billion in 2023, $35.1 billion in 2024, $29.8 billion in 2025. The trailing four quarters through June add up to $33.7 billion. A stock whose earnings swing that much has not escaped its commodity. It has, at best, learned to pay its holders through the swings.
What discipline looks like in the numbers
The discipline claim has three parts: pay the dividend, retire shares, and keep capital spending in check. Here is the record from the cash flow statement, in billions of dollars.
| $ billions | FY2021 | FY2022 | FY2023 | FY2024 | FY2025 |
|---|---|---|---|---|---|
| Operating cash flow | 48.1 | 76.8 | 55.4 | 55.0 | 52.0 |
| Capital spending | 12.1 | 18.4 | 21.9 | 24.3 | 28.4 |
| Free cash flow | 36.1 | 58.4 | 33.5 | 30.7 | 23.6 |
| Dividends paid | 14.9 | 14.9 | 14.9 | 16.7 | 17.2 |
| Net share repurchases | 0.2 | 15.2 | 17.7 | 19.6 | 20.3 |
Dividends held at $14.9 billion for three years and then rose to $17.2 billion. The trailing dividend is $4.08 a share, a 2.49% yield. Buybacks went from $0.2 billion in 2021 to $20.3 billion in 2025. Together they returned $37.5 billion to shareholders in 2025, which is 72% of the $52.0 billion of operating cash flow.
The promise was kept. In 2021 Exxon also repaid $19.7 billion of net debt, and in 2025 net borrowing was a small positive $0.1 billion, so the money did not come from the credit line.
Now the part the title skips. Capital spending has not been held down. It went from $12.1 billion in 2021 to $28.4 billion in 2025, a 2.3-fold increase, while operating cash flow fell from $76.8 billion in 2022 to $52.0 billion. Free cash flow followed it down, from $58.4 billion to $23.6 billion.
That is the tension. Exxon returned $37.5 billion in 2025 out of $23.6 billion of free cash flow, a shortfall of $13.9 billion. The cash balance went from $23.0 billion to $10.7 billion, a drop of $12.3 billion, which is most of the gap.
Reading the shortfall
I would not call it a warning yet. A company holding $23.0 billion of cash at the end of 2024 can choose to spend some of it. Capital spending at this level is also a decision to grow production, and the cash cost arrives before the barrels do. I have no production data in the database to check whether the spending is earning its keep, so I am treating it as unproven rather than as wasted.
But the dividend is worth a closer look. The 2.49% yield is lower than the Federal Reserve’s target range of 3.75% to 4.00% after its September 16 increase, which our piece on the September 16 meeting discusses. A holder who wants income can now get more from cash than from the Exxon dividend. The case for the stock therefore has to rest on the growth of the payout, and the growth of the payout has to come from free cash flow, not from drawing down the balance sheet.
The same discipline question appears in a very different industry. The Oracle backlog piece is about spending that has to turn into revenue booked in advance, and the honest comparison with Exxon is that both companies ask shareholders to accept large capital outlays today for cash later.
Valuation: paying for a recovery already in the forecast
At $164, Exxon trades at 21.0 times trailing earnings, against a five-year average of 10.1. That looks expensive until you look at the forward number: 13.5 times, close to the industry average of 13.0. Forward EPS of $12.14 compares with trailing $7.77, an implied 56% increase. The whole gap between 21.0 and 13.5 is that one bet: the second-quarter profit level has to repeat.
Price-to-book is 2.6 against a five-year average of 2.1, at the 99th percentile of the stock’s own range. Price-to-sales is 1.9 against 1.4. On every backward-looking gauge, the stock is priced at the top of its recent history. The market has paid for the recovery already.
The 16 analysts in the database rate it half buy and half hold, with no sells. Their average target is $170, 4% above the price, and the range runs from $155 to $185. The low target is 5% below the current price. That is a narrow spread for an oil company, and I read it as analysts agreeing the stock is fairly priced, not as confidence.
The stock is 6.1% below its 52-week high of $174 and 52% above the low of $107. Its quantitative grade in the database is B, up from D on September 8. Short interest is 1.0% of float. I do not see a crowded trade in either direction.
For comparison, the JPMorgan piece looks at a large financial trading near its record high and asks what a buyer at that multiple is betting on. Exxon at 13.5 times forward earnings asks a similar question with a commodity in the middle: the answer is that the buyer is betting the profit is repeatable, and the record does not yet support that.
The risk: what would make this view wrong
There are two ways I could be wrong, and they point in opposite directions.
The bearish risk is that the second quarter was the peak. Net income of $14.9 billion was 3.3 times the $4.5 billion of the quarter before it. Forward EPS of $12.14 assumes something close to that level repeats. If commodity prices retreat and quarterly profit slides back toward the $4.5 billion range, the forward multiple of 13.5 is really a trailing multiple above 20 again, and the stock has little valuation support. Add capital spending that has already more than doubled since 2021, and the cash return program would then be running on borrowed room.
The bullish risk, for anyone who reads this as a sell signal, is the opposite. The shortfall in 2025 could be a one-year event: a heavy investment year at a weaker price, funded from a cash pile that management deliberately built. If the spending turns into growth and the second-quarter profit level proves durable, $37.5 billion of returns is comfortably covered and the stock is cheap at 13.5 times forward earnings. I would then have sat out a good year for an accounting-flavored reason.
I lean toward the cautious reading because the evidence for it is in reported cash flow, while the evidence for the optimistic reading is a forecast.
What I am not covering
I am not modeling the price of oil. The database has no such series, and any Brent forecast I offered would be outside my evidence. I am also leaving out the Pioneer acquisition and Guyana: the filings in the database do not break out production by field, so I cannot connect either to the cash numbers above.
The power-demand angle is the other omission. Our NextEra piece covers the electricity side of the energy transition; I have no evidence linking Exxon’s cash flow to it in either direction.
The cash gap I would hold management to
Here is the number: $13.9 billion. That is how far 2025 shareholder returns of $37.5 billion exceeded free cash flow of $23.6 billion. If fiscal 2026 free cash flow reaches roughly $38 billion, which would take a second-quarter profit level repeating through the year, the discipline case holds. If returns exceed free cash flow again and year-end cash falls below $10.7 billion, I would stop calling this a discipline story and start calling it a bet on the oil price.
Gavin Thorne has invested in U.S. stocks for six years and previously worked at a large publicly traded internet company. He writes about income-oriented strategies, including cash-secured puts, and about how he reads company data. This article reflects his personal research process and is for informational purposes only. It does not constitute investment advice.
Sources: Dividends (SEC Investor.gov glossary) (https://www.investor.gov/introduction-investing/investing-basics/glossary/dividend) · Dividends tax topic (IRS) (https://www.irs.gov/taxtopics/tc404)