
Oracle generated $31.98 billion of operating cash flow in fiscal 2026 and spent $55.66 billion on capital expenditure. Subtract one from the other and the company was $23.7 billion short of paying for its own buildout. That is the number I keep returning to, because the title of this post leans on something our own data cannot show you.
The backlog is the claim. Oracle has told investors that a very large amount of contracted AI revenue is signed and waiting to be delivered, and that it stretches across the next several years. Our database carries no remaining-performance-obligation line for Oracle, so I cannot check that figure, and I am not going to quote one from memory. What the database does carry is the price of turning a signed contract into a delivered one: capital spending, operating cash, debt and margins. Those are measured, they are Oracle’s own reported figures, and they tell you whether the stock’s demand for proof is fair.
My view is narrow. The backlog may well be real, but the financial statements already show Oracle paying for it with borrowed money, and at $147.61 the stock is priced as though delivery is uncertain rather than assured. That is a reasonable price, not a mistake.
The bill for the buildout
Start with the cash. Capital expenditure ran $4.51 billion in fiscal 2022, $8.70 billion in 2023 and $6.87 billion in 2024. Then $21.22 billion in fiscal 2025, and $55.66 billion in fiscal 2026. The last figure is 12.3 times the 2022 level.
Operating cash flow grew too, from $9.54 billion to $31.98 billion, so this is not a company starving. But growth in the cash engine ran at roughly 3.4 times over four years while spending on the buildout ran at more than 12 times.
The ratio tells it plainly. In fiscal 2025, capital spending took 102 cents of every dollar of operating cash flow, which was already more than the business was generating: a free cash flow of $-0.4 billion. In fiscal 2026 it took $1.74 for each dollar, and free cash flow reached $-23.7 billion. Over the two years combined, Oracle spent $76.9 billion on the buildout against $52.8 billion of operating cash.
Against revenue, the spending is even harder to wave away. Capital expenditure equalled 37% of fiscal 2025 revenue of $57.4 billion and 83% of fiscal 2026 revenue of $67.4 billion. A software company that once earned its returns with almost no physical assets is now spending more than four-fifths of its annual sales on buildings, power and chips.
| Metric | Value | Context |
|---|---|---|
| Price (approx.) | $147.61 | 52-week range $114 to $326 |
| P/E (TTM) | 23.1x | Five-year average 34.7x |
| Price-to-sales | 6.3x | Five-year average 7.0x |
| Analyst ratings | 86% buy, 14% hold | 28 analysts; average target $254 |
| Dividend yield | 1.35% |
Who is paying for it
Debt is paying for a good part of it. Oracle’s short- and long-term debt and lease obligations together stood at $104.1 billion at the end of fiscal 2025 and $156.2 billion a year later, an increase of $52.1 billion. Cash and short-term investments rose over the same period, from $11.2 billion to $31.9 billion, so the company raised more than it spent in the year. Net of cash, the obligation moved from $92.9 billion to $124.3 billion.
Two readings compete. The generous one says a company with signed customers should borrow against them: the debt is matched to contracts, and cash that arrives in the bank ahead of the buildout is a sign of lenders who believe the backlog. The harsh one says the borrowing funds capacity built for customers whose own funding is not guaranteed, and that a lender can be as wrong as an equity holder.
I lean toward the harsh reading for one reason. A backlog is a promise, not a receivable: it becomes cash only when the capacity is built, powered and accepted by the customer. I cannot measure customer credit from our data and will not pretend to. But it is why the market discounts the number.
Compare how other large AI spenders have been treated when the bill arrived. Our note on Microsoft’s AI bill coming due asks the same question of Azure, and our look at Meta’s $19 billion quarter of AI spending is a reminder that investors have punished spending before revenue appears. Oracle’s version has the added feature that it does the spending with less cushion.
What the operating business is doing
None of this means the underlying business is weak. Revenue reached $67.4 billion in fiscal 2026, up 17% from $57.4 billion, and operating income rose to $22.4 billion. The quarter reported on 2026-09-10 showed revenue of $19.3 billion, up 30% from a year earlier, the fastest of the last four quarters (the earlier three were up 14%, 22% and 21%).
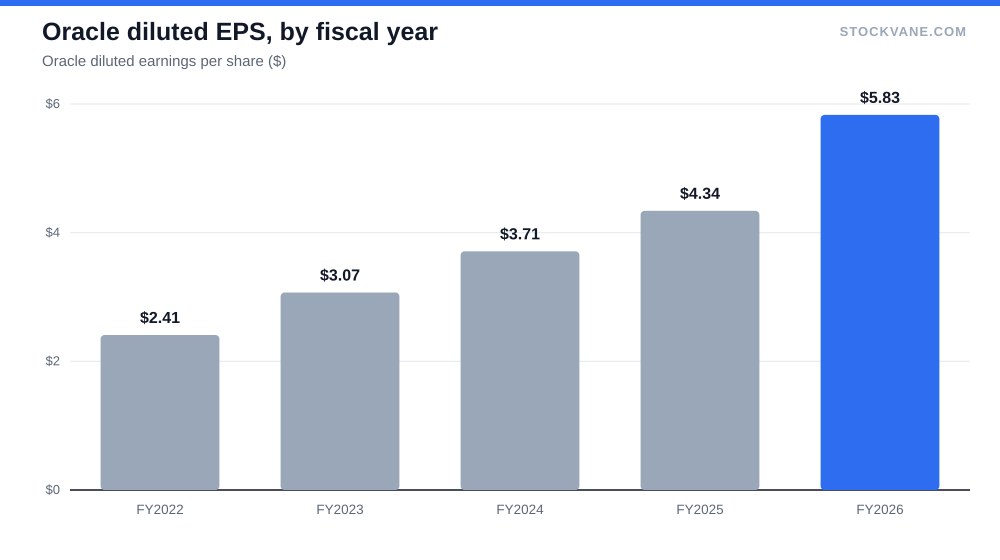
Net income was $17.1 billion, against $12.4 billion the year before. Earnings per share came to $5.83, up 34%.
Then the flaw. Gross margin fell to 65.8% from 70.5% in a single year, and it was 80.6% in fiscal 2021. Renting out GPU capacity is a lower-margin business than selling database licences, and the mix is moving in that direction. The operating margin held up better: 35.9% on the database’s EBIT measure, against 30.9% the year before. (Operating income divided by revenue gives 33%, the figure I use when I compare it with the table; the EBIT figure differs slightly because of how the database treats certain items.)
So the profit line is rising even as the gross margin falls, which means operating expenses are growing more slowly than sales. That can continue for a while. It cannot continue if the cost of running the data centers, especially power and depreciation on the new chips, arrives faster than revenue from them. Depreciation on $77 billion of two-year spending has hardly started to hit the income statement.
What the multiple says
At $147.61 the stock is 54.7% below its 52-week high of $326 and 29% above its low of $114. The trailing P/E is 23.1, against a five-year average of 34.7. The stock therefore trades at 0.67 times its own history, and the current multiple sits in about the 8th percentile of the last five years. On forward earnings of $7.16 the multiple is 20.6. Our valuation page for Oracle has the full history.
Read that carefully. A P/E in the low twenties is not expensive in absolute terms. Against the five-year average it is a third lower. But it is a multiple on earnings that the market suspects are about to be diluted by depreciation and interest. If you believe forward EPS of $7.16 is safe, the shares are cheap. If you think it is a peak that heavy depreciation will bend, 20.6 times is fair.
Analysts lean toward the first view. Of 28 covering the stock, 86% rate it a buy, and the average target of $254 implies 72% upside. The lowest target on the sheet is $145, which is -2% from the price, so even the most cautious analyst is roughly at today’s level. I would not treat that spread as proof of anything: targets follow prices, and the highest one, $400, is 171% away.
The stock’s own quant grade on our platform slipped to E from D in the space of two weeks. That is a momentum and valuation blend, not a verdict on the backlog, but it says the market is not currently rewarding the story.
Where I could be wrong
The opposing evidence is the revenue growth itself. If Oracle were only borrowing to build capacity nobody wanted, revenue would not be accelerating to 30% year over year, and the $77.4 billion annualized run rate would look thinner. The buildout is meeting real demand today. My argument is only that demand today does not pay for capacity that is still being poured in concrete.
The condition that would prove me wrong is simple: free cash flow. If capital expenditure stops rising while operating cash flow keeps climbing at the recent pace, the $23.7 billion shortfall narrows without any help from new borrowing, and the debate ends in Oracle’s favor. That could happen within two fiscal years if the spending peaks. It fails if customers ask for more capacity than the company has funded, because each new commitment adds spending before it adds cash.
There is also a technology risk. The chips being installed today will be superseded, and if depreciation schedules are too generous, earnings are flattered now and paid for later. I cannot measure that from the database, so I treat it as a reason for a lower multiple, not as a number.
What I am not covering: the terms of individual contracts, the counterparties, and any figure for the backlog itself. None of those is in our data, and a post that quotes them would be repeating claims rather than testing them.
Dividend holders should note 1.35% and $2.00 per share a year: it is modest, and it is not the reason to own this stock. Investors who came for income from a database company have been overtaken by a construction project. For a broader look at how we screen income names, see how I pick stocks.
The two lines that would settle the backlog question
Two figures will do it. First, capital expenditure as a share of operating cash flow: it was 174% in fiscal 2026, and I want to see it fall toward 100% within a year, not rise. Second, gross margin: I would not want it below 62% after another quarter of GPU-heavy mix.
If both hold, the stock at 23.1 times earnings looks cheap and I would be wrong to have waited. If capex takes more than 174 cents of each operating dollar again next year, the answer to the title is that the backlog is booked and the stock is right to ask for proof.
Gavin Thorne has invested in U.S. stocks for six years and previously worked at a large publicly traded internet company. He writes about income-oriented strategies, including cash-secured puts, and about how he reads company data. This article reflects his personal research process and is for informational purposes only. It does not constitute investment advice.
Sources: Dividends (SEC Investor.gov glossary) (https://www.investor.gov/introduction-investing/investing-basics/glossary/dividend) · Dividends tax topic (IRS) (https://www.irs.gov/taxtopics/tc404)