
On September 10 the StockVane momentum grade for Mastercard was a C with a score of 64. On the next snapshot it was a D with a score of 19. Over those same two sessions the stock closed at $565.37 and then at $569.19, so the shares went up while the score fell by 45 points.
I can’t see the model’s inputs from where I sit, so I won’t pretend to explain that jump. What I can say is that Visa made the same drop on the same date, from 56 to 33. Two companies that run the same business were marked down together, and neither had a bad day. The grade is reacting to how these stocks have traded over recent weeks, which makes it a poor guide to how the companies are doing.
So here is my position. The D is not a reason to avoid Mastercard. But the business is showing one thing I would want to watch: revenue growth has stepped down for three quarters running, and the stock is already priced as though that is fine.
A grade that moved when nothing happened
The score is recorded every day on the rating history page. Mastercard sat at 64 or 65 for the snapshots of September 8 to 10, dropped to 19 on the 11th, drifted up to 27 and is at 24 now. The price since September 2 went from about $588 to $565, a decline of less than 4%.
StockVane’s grade is a short-horizon momentum signal. It asks whether a stock has been trading well and does not ask whether the business is good. A payments company that fell from $588 to $565 in two weeks will score badly on that test even if its revenue rose 14% in the same quarter. Mastercard is 6% below its 52-week high of $601 and about 22% above its low, so the stock is neither broken nor strong. A D is what that middle position looks like to a model built for a five-day holding period.
That is also why I read the grade as timing information. If you already own the stock for the long run, a D changes nothing. If you plan to buy, it says the tape has not been friendly lately.
Growth is slowing, and it is still very good
On the financials tab the business keeps compounding. Revenue reached $32.8 billion in 2025, up 16%, and operating income rose to $19.5 billion. Operating margin was 59.5%, up from 58.0% a year earlier and from 53.3% in 2020. Diluted EPS was $16.52, up 19%. Very few companies of this size add six points of margin over five years, and that margin is what the multiple is really paying for.
Quarter by quarter the picture is less flattering. Year-over-year revenue growth was 17% in the third quarter of 2025, 18% in the fourth, then 16% and 14%. The latest quarter brought in $9.28 billion. Mastercard’s own report puts net revenue growth at 12% on a currency-neutral basis, with cross-border volume up 12% and switched transactions up 9%, according to its second-quarter earnings release. Currency added about two points to the reported 14%, and that is a tailwind nobody controls.
None of this is a warning sign by itself. A company growing 14% at this size is doing something rare. But a multiple built on 16% to 19% growth has to be re-examined when the quarterly rate is running two to five points lower, and I think that is what the stock has been doing quietly since spring.
The multiple already moved
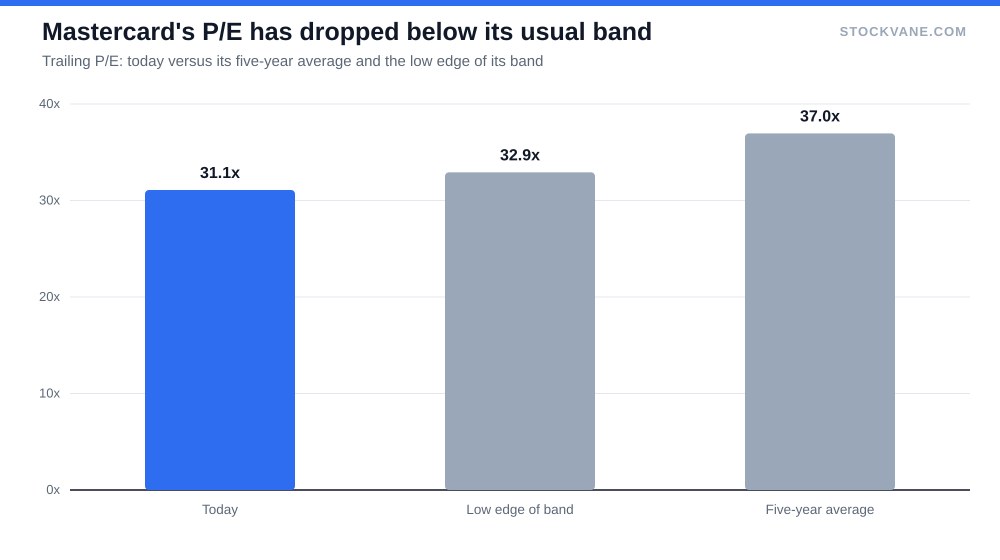
On valuation, the valuation tab shows a trailing P/E of 31.1, against a five-year average of 37.0. The lower edge of its usual band is 32.9, so the stock is below that band, at the 10th percentile of its own history. The forward P/E is 27.1, which implies analysts expect earnings near $20.83 a share over the next year, about 15% above the $18.18 of trailing earnings.
So the stock is down about 3% over the past year (from $582.97 to $565.24) while EPS grew 19% in 2025. The market has been shrinking the multiple as growth cools, and it has taken a good part of that adjustment already. A P/E of 31 is still well above the industry average of 22.1, which is the premium you pay for a business with almost no credit risk and a margin near 60%.
Visa gives a useful comparison because the two companies are so alike.
| Company | Trailing P/E | Forward P/E | FY2025 revenue growth | StockVane grade |
|---|---|---|---|---|
| Mastercard (MA) | 31.1x | 27.1x | 16% | D (24) |
| Visa (V) | 31.3x | 25.9x | 11% | D (34) |
| American Express (AXP) | 18.9x | 17.9x | 10% | D (23) |
Visa earns a higher operating margin, near 66%, but is growing more slowly. The two trade at almost the same trailing P/E, about 31, while Visa’s forward multiple is lower, so Mastercard is asking for a little more for the faster growth. I wrote about the other side of this pair in our piece on Visa as a toll road, where the question was who builds the bypass. The same question applies here, and I still think it is the right one.
What the analysts are pricing
Of the 24 analysts covering Mastercard, 92% rate it a buy and the rest say hold, none sell. The analyst consensus page shows an average target of $665, about 18% above the current price, with a high of $740 and a low of $550. That low target sits about 3% below where the stock trades, so at least one analyst who follows the company closely thinks the shares are fairly priced or a little rich.
I would not lean hard on the average target. Targets tend to follow the price, and consensus buys are not rare in a group where every company is a category leader. So the sell side is not questioning the business. Where it disagrees at all, the argument is about price.
Earnings days have not been dramatic, which fits a company whose results are rarely a surprise. The last four moved the shares by +2.5%, -4.2%, +4.3% and -0.2%, and only about 0.9% of the float is sold short, so there is no crowded bet waiting to unwind either way.
The risks I would actually track
Regulation is the nearest risk. A judge gave preliminary approval on June 9 to a revised settlement between Visa, Mastercard and U.S. merchants. According to reports on the ruling, it would cut interchange fees by 0.1 percentage points for five years, cap standard consumer card rates at 1.25% and give merchants more freedom to add surcharges. Interchange goes to card issuers and not to Mastercard, so the direct hit to its revenue is smaller than the headline suggests. The indirect one, if surcharging or choosier merchants slow card volume, is harder to size. Final approval is not expected until late 2026 or early 2027.
Alternatives to the card rails, such as real-time bank payments and stablecoins, are slower-moving and potentially larger. They have been discussed for years without denting Mastercard’s numbers. I would still watch whether growth in value-added services, which the company has been leaning on, keeps its pace as payment volume growth normalizes. If it does, the multiple can stay where it is. If it doesn’t, 14% is not the floor.
Then there is the arithmetic. The scenario grid below shows what the stock could be worth in two years, given different growth rates and multiples, starting from about $18.18 of trailing EPS.
| EPS growth per year | At 22 times earnings | At 26 times earnings | At 31 times earnings (about today) |
|---|---|---|---|
| 10% | $484 (-14%) | $572 (+1%) | $682 (+21%) |
| 14% | $520 (-8%) | $614 (+9%) | $732 (+30%) |
| 18% | $557 (-1%) | $658 (+16%) | $785 (+39%) |
At today’s multiple of 31 and EPS growth of 14% a year, the arithmetic gives roughly $732 in two years, about 30% above today. If the multiple falls to 26 while growth holds at 14%, the answer is about $614, still 9% higher. The uncomfortable row is 10% growth with a multiple of 22, the industry average, which lands near $484, or about 14% below the current price. That row is a plausible downside. A worse one would need growth to fall further.
What I’d need to see
Mastercard pays about $3.48 a share a year, a yield under 0.6%, after raising the quarterly dividend 14.5% to $0.87. This is not a stock I would own for income. That is exactly why, on my side, the more natural way to approach it is to be paid while waiting: I’d think about selling a cash-secured put well below the market, something near the $520 area where the stock traded in the early summer, so that an assignment would come at a price I’d already be happy to pay. I explain how I think about that in our guide to selling puts. It’s a way to express patience, not a substitute for a view.
The view itself is that the business is excellent and the stock is fairly priced for a growth rate that is trending down. I would want to see two things before I got more excited. One is a quarter where revenue growth stabilizes at 14% or better on a currency-neutral basis. The other is a price closer to 26 times forward earnings, which is near $541.
Until then, a D on the momentum grade is a correct description of the last few weeks, and I would not read anything more into it.
Gavin Thorne has invested in U.S. stocks for six years and previously worked at a large publicly traded internet company. He writes about income-oriented strategies, including cash-secured puts, and about how he reads company data. This article reflects his personal research process and is for informational purposes only. It does not constitute investment advice.