
The Coca-Cola October 16 put with an $82.50 strike bids $0.20 and asks $0.23. That is roughly a quarter of one percent of the cash you would set aside, for four weeks of agreeing to buy a $88 stock at $82.50 if it falls. When I sell puts, I want the price of waiting to mean something. On Coca-Cola it barely does, and the reason sits in the same place as the stock’s valuation: the market has already paid for a lot of good news.
Here is the news. Coca-Cola’s operating margin has risen for three years running, from 28.0% in fiscal 2022 to 28.6%, 29.8% and 31.1% in 2025, the highest of the last six years. The trailing P/E is 26.5, almost exactly its five-year average of 26.3. That looks like a fair price for a steady company. My view is that it flatters the stock, because the ratio that includes the margin gain, price to sales, sits at the top of its own history.
Three years of margin, on a business that barely grew
Revenue was $47.94 billion in fiscal 2025, up only 2% on the year before. Operating income was $14.91 billion, up 6.3%. Most of the profit growth over this stretch came from earning more on each dollar of sales, not from selling many more dollars of it. The financials tab has the full history if you want to check the arithmetic.
| Fiscal year | Revenue | Revenue growth | Operating income | Operating margin | Net income | Diluted EPS |
|---|---|---|---|---|---|---|
| FY2021 | $38.7B | 17% | $11.0B | 28.6% | $9.8B | $2.25 |
| FY2022 | $43.0B | 11% | $12.0B | 28.0% | $9.6B | $2.19 |
| FY2023 | $45.8B | 6% | $13.1B | 28.6% | $10.7B | $2.47 |
| FY2024 | $47.1B | 3% | $14.0B | 29.8% | $10.6B | $2.46 |
| FY2025 | $47.9B | 2% | $14.9B | 31.1% | $13.1B | $3.04 |
Our data does not say how much of the margin gain came from pricing, product mix or lower costs, and I would be wary of anyone who claims to know from the outside. What the figures do show is a company whose reported margin sits 1.6 points above where it was in 2020, when it stood at 29.5%, and it got there after a dip to 28.0% in 2022.
One more figure narrows it down. Gross margin, the share of revenue left after the cost of goods, went from 59.5% in fiscal 2023 to 61.6% in 2025, a gain of 2.1 points. Operating margin rose 2.5 points over the same two years. So most of the improvement, about four fifths, happened before overhead, in what the company earns on the product itself. That points toward price, mix and input costs, and away from cost cutting in the office. It also means the gain depends on customers continuing to pay up, which is the part I cannot test.
The counter-case is a good one and I do not dismiss it. As I understand the business, Coca-Cola sells concentrate and licenses its brands, and leaves much of the heavy work of bottling to partners, so its margin is structurally higher than that of a typical beverage company. If the gain is mostly structural, a return to 28.6% is unlikely, and paying up for it is defensible. What would make me wrong is a few more years like the last three. Margin is a slow-moving number, and one bad quarter would not prove anything.
Where earnings outran the business
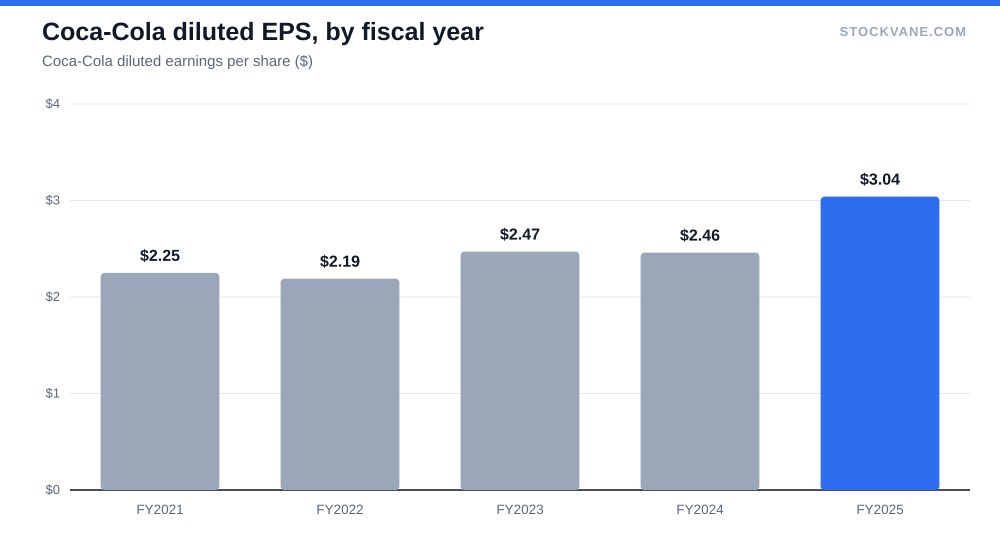
Diluted EPS rose 24% in fiscal 2025, from $2.46 to $3.04. Operating income grew 6.3%. Those two numbers should not be that far apart, and the gap deserves a closer look.
The difference opens up below the operating line. Net income was 88% of operating income in 2025, against 76% in 2024 and 82% in 2023. Something outside operations, such as investment gains, a lower tax rate or a smaller interest bill, pushed net income up 23%. I cannot tell from our data which one, and it matters. If part of last year’s EPS is a one-time lift, then the 26.5 P/E is understating what you are paying for repeatable earnings.
A rough check: at the current $88.25, the stock trades at 35.9 times fiscal 2024 earnings per share of $2.46 and 35.7 times 2023’s $2.47. It looks cheaper than those numbers only if the 2025 jump holds. The forward P/E of 25.6 implies analysts expect about $3.44 a share over the next year, another 13% on top of 2025. That is a demanding path for a company that grew revenue 2% last year.
The top line has picked up
To be fair to the bulls, the sales side looks better than the annual figures suggest. Revenue grew 12% year over year in the quarter reported in April and 7% in the quarter reported in July, when it reached $13.38 billion. That is a real change from the 2% annual pace. I do not know how much of it comes from currency, acquisitions or price increases, so I would not extrapolate it.
North America supplied 40% of that July quarter, Europe, the Middle East and Africa 24%, Latin America 14%, Asia Pacific 12% and Bottling Investments 11%. The stock has behaved well on reports lately. The last four report days moved it +5.0%, +3.9%, -1.5% and +4.1%, an average swing of 3.6%. Three of the four were gains.
What the price is paying for
The valuation tab tells the story in two lines. Trailing P/E is 26.5, at the 54th percentile of its five-year range, and industry average is 24.4. On earnings, Coca-Cola looks ordinary. Price to sales is 7.6, against a five-year average of 6.3 and a band that tops out at 6.8. It sits at the 99th percentile, and the industry average is 3.3.
| Ratio | Coca-Cola today | Five-year average | Industry average | Percentile in five-year range |
|---|---|---|---|---|
| Trailing P/E | 26.5 | 26.3 | 24.4 | 54th |
| Price to sales | 7.6 | 6.3 | 3.3 | 99th |
| Price to book | 10.5 | 10.7 | 6.7 | 49th |
The two ratios disagree because margins moved. Investors are paying the usual price for each dollar of profit, and a record price for each dollar of sales. That is only sensible if the margin is permanent. For scale, the same multiple of sales is a good deal easier to hold when the company makes 31 cents of operating profit on the dollar than when it makes 28.
What a slip in margin would cost
Suppose operating margin drifts back to fiscal 2023’s 28.6%. On fiscal 2025 revenue, that is $13.72 billion of operating income, about 8% below the $14.91 billion the company earned. To hold operating income flat at that margin, revenue would have to reach $52.1 billion, a gain of 8.6%. Recent quarters have grown faster than that, and the annual pace has not.
I am not forecasting a reversal. A reasonable middle case is that margin holds near 31% and revenue grows in the mid single digits, which supports today’s price and not much more. Analysts are more generous. Their 17 ratings are 94% buy, and the average target of $97 sits 10% above the price. The lowest target, $86, is only 2.5% below it, and the highest, $104, is 18% above. A narrow range like that says there is little disagreement, and little disagreement usually means little margin for surprise in either direction.
A note on timing. The margin story and the valuation story are separate questions, and they can be right at different times. A stock can carry a record price-to-sales ratio for years while the margin holds. The risk is asymmetric, though. If the margin holds, the multiple stays where it is and the shares earn roughly what the business earns. If it slips, both the earnings and the multiple can fall at the same time.
How it compares, and what I am leaving out
The obvious comparison is other staples that command a premium. Walmart has a software-like multiple, which our note Walmart Trades Like a Software Company examines, and Costco at 50 times earnings is priced even higher. Coca-Cola at 26.5 is the modest one of the group, which is the case for owning it. I would still want a margin of safety the price does not offer today.
Two things I am not covering. Shifts in consumer demand for sugary drinks are hard to test without unit volume, which our data does not include. And I have no view on currency effects on reported sales. Both could change the read.
The stock is 4% below its 52-week high of $91.94 and 39% above its low of $63.66. Short interest is small, 0.9% of float with 2.7 days to cover, and the StockVane quant rating is a C with a score of 62, which I read as neutral. For an investor who wants the dividend, the yield is 2.36%, and the comparison of high dividend yield and dividend growth is a better starting point than the ticker.
Where I would start selling puts
Back to the option that started this. The $82.50 put expiring October 16 has 2,156 contracts of open interest, an implied volatility of 19.9% and a delta near -0.09, so the market puts the odds of assignment at roughly one in eleven. The strike sits 6.5% below the current price. A $0.215 midpoint on $82.50 of cash is 0.26% over four weeks. My guide to selling put options explains why I want more than that for tying up cash.
That is the honest trade-off with a stock like this. Low volatility is the reason people own it, and it is also the reason the option pays so little. Selling puts works best where fear is priced in, and here it is not. So I would not sell this put at these prices. I would start looking when the stock is nearer $80 or the premium on a strike about 7% out reaches half a percent a month. On the fundamental side, the number to watch is operating margin at the next annual report. A print below 30% would say the gains are unwinding and the price to sales premium has nothing under it. A print at 31% or better, on revenue growth of 5% or more, would make the multiple easier to defend.
Gavin Thorne has invested in U.S. stocks for six years and previously worked at a large publicly traded internet company. He writes about income-oriented strategies, including cash-secured puts, and about how he reads company data. This article reflects his personal research process and is for informational purposes only. It does not constitute investment advice.
Sources: Dividends (SEC Investor.gov glossary) (https://www.investor.gov/introduction-investing/investing-basics/glossary/dividend) · Dividends tax topic (IRS) (https://www.irs.gov/taxtopics/tc404)