
At $745.61, the price of an AppLovin share was 57 times what the company now earns per share over twelve months. At $308.06, the multiple is 23.7. The stock fell 58.7% from that high while trailing profit kept climbing, so the price and the earnings have been moving in opposite directions all year.
That is why the title of this piece, that the stock has already priced in the next five years, needs a test instead of a nod. It was a fair description of the $746 stock. My argument is that it is no longer a fair description of the $308 stock, and the arithmetic below shows why: at today’s price the market is paying for a good deal less than five years of growth, and the real disagreement is over whether the growth itself survives.
What the price implies, in five lines of arithmetic
Trailing diluted earnings per share come to $13.01. Analysts’ forward figure is $17.73, which is 36% higher. That forward number is a one-year forecast and I would not stretch it over five years, but it gives a reference point.
Suppose you want the stock to trade at 15 times earnings in five years, a multiple that would fit a healthy but ordinary large-cap. What does earnings per share have to do between now and then? At the $745.61 high, it has to compound at about 31% a year, from $13.01 to roughly $49.70. At the current $308.06, it needs about 9.6% a year. That is a rate a mature software company might manage on a good day.
Push the terminal multiple up to 20 times and the picture loosens further. From today’s price, EPS needs to grow only about 3.4% a year. From the high, 23%.
| Entry price | P/E on trailing EPS | EPS growth a year for 15x in 5 years | EPS growth a year for 20x in 5 years |
|---|---|---|---|
| 52-week high, $745.61 | 57.3x | 30.7% | 23.4% |
| Average analyst target, $516.80 | 39.7x | 21.5% | 14.7% |
| Current price, $308.06 | 23.7x | 9.6% | 3.4% |
I ran the same kind of exercise on Palantir, and it is the cleanest way I know to turn a multiple into a growth requirement. I chose 15 and 20 times myself, and a reader who wants 12 or 30 can rerun the numbers in a minute. What does not change is the shape of the table. The high demanded a decade of exceptional results squeezed into five years. The current price demands a slowdown that is merely not catastrophic.
The business behind the arithmetic
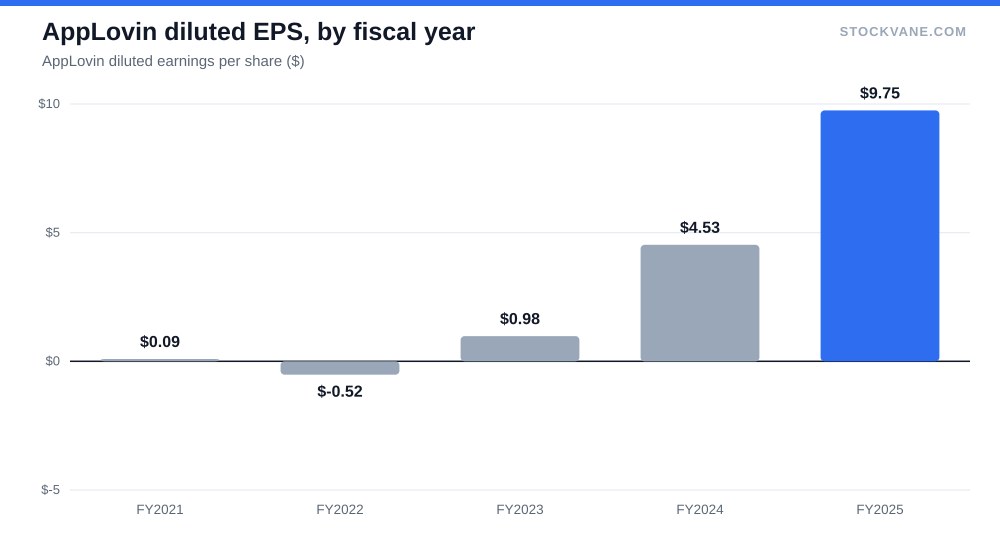
Operating margin, on the financials page, went from negative 1.7% in 2022 to 76% in fiscal 2025. Revenue over the same window went from $2.8 billion to $5.5 billion, though it dipped to $1.8 billion in 2023 on the way. Net income reached $3.3 billion in 2025, up from $1.6 billion a year earlier, and diluted EPS doubled from $4.53 to $9.75.
Gross margin tells you where that came from. It was 55.4% in 2022, 67.7% in 2023, 75.2% in 2024 and 87.9% in 2025. Each extra dollar of revenue is increasingly a dollar that stays. I would not assume that trend continues, because a gross margin near 88% leaves little room to improve and a lot to lose if pricing softens.
| Metric | Value | Context |
|---|---|---|
| Price (approx.) | $308.06 | 52-week range $298 to $746 |
| P/E (TTM) | 23.7x | Five-year average -8.9x |
| Price-to-sales | 15.5x | Five-year average 13.7x |
| Analyst ratings | 81% buy, 19% hold | 21 analysts; average target $517 |
Then there is growth itself, which is where the real argument starts. Quarterly revenue growth ran at 68%, 66%, 59% and 53% over the last four reported quarters, and the latest quarter’s $1.9 billion was only 4% above the one before it. Growth is still fast. It is also slowing every quarter for a year, and the price has plainly noticed.
The chart above is the reason I do not treat the multiple compression as irrational. Margin went from a loss to three-quarters of revenue in three years, and that kind of step cannot be repeated. Anyone who bought at $746 was paying for another leg like it. Margin can hold, but it cannot double again, so from here EPS growth has to come from revenue, and revenue growth is the number that has been drifting lower.
There is a second-order point about the market’s reaction to news. The stock fell after two of the last four reports and rose after two, and the sizes were 11.6% on average. When a stock reacts that violently to a print, the print is being read as a verdict on the whole growth path, not on one quarter. That is what a valuation looks like when the market is unsure which of two very different companies it owns: one still growing above 50%, or one whose growth has started to converge on its peers.
Where the stock is still expensive
Not on earnings. On sales, the valuation tab shows a price-to-sales ratio of 15.5 against a five-year average of 13.7, and the industry average in our data is 2.4. The stock is not cheap on that measure at all. It is priced as a business whose margins will hold.
That is the fair reading of why the P/E looks low. A 76% operating margin is a number the market treats with suspicion, because margins that high invite competition, regulation or a pricing reset. If the margin fell to 50%, earnings per share would fall by about a third at unchanged revenue, and the 23.7 would look like 36 times. The stock is cheap on trailing profit only if the profit is durable.
I have no data in our feeds that lets me attribute the drop in the stock to a specific cause, and I am not going to invent one. The recent reactions are measurable. The stock moved -19.7% after the report on 2026-08-05, and it fell 19.7% after the February 11 report too. The average earnings-day move is 11.6% in either direction, so two of the last four reports produced moves close to double the norm.
The counter-case, and the Street’s number
Analysts are more optimistic than the tape. Of the 21 analysts covering the stock, 81% rate it a buy, and the average target of $517 sits 68% above the price. The lowest target is $325, only 5% above the stock, while the highest is $790, which is 156% higher. That spread, from 5% to 156%, is a useful thing to read: the analysts agree on direction and disagree on magnitude by a factor of thirty.
The StockVane quant grade is E, down from D a week ago (score 1 out of 100 today, against 40). The grade leans on price momentum, so a stock that has fallen 58.7% lands there mechanically. I would not use it as evidence about the business, only as evidence that the tape is bad. Short interest is 3.2% of float at 2.2 days to cover, which is not a crowded short. Nobody is pressing a large bet against the company, and nobody is chasing it up either.
The case for the title, and why I do not buy it now
The best version of the title’s argument goes like this. Consensus EPS of $17.73 is forecast growth, and growth forecasts on high-margin businesses tend to be revised down as the comparison gets harder. The FY2025 growth rate of 115% in EPS cannot repeat, and the latest quarterly revenue growth of 53% is the slowest in the four-quarter series. If growth keeps stepping down, the five-year compounding I used above falls short, and a price that looks cheap on the trailing number can be expensive on the one that arrives.
That is a sound argument. It is an argument about the next several quarters, though, and not about five years already banked. At $308, you need about 10% annual EPS growth to be at 15 times earnings in 2031, and the company is currently growing revenue at 53%. I would call the stock priced for a sharp slowdown. It is not priced for perfection, which is what the $746 stock was.
What would prove me wrong is simple to state. If EPS growth falls to the single digits without a matching fall in the multiple, or if the operating margin loses ten points or more in a year, the arithmetic above stops working and the stock is no bargain at any price near this one.
Oracle is the recent comparison I keep returning to, because its backlog is a stock where the question is also how many years the price already assumes. AppLovin has no backlog to point at. Its evidence is the trailing income statement, and that makes the forward growth rate the whole argument.
A five-year framing has one more weakness, and I should say it. I am extrapolating from a company whose revenue fell 35% in 2023 and then grew 75% and 70% in the next two years. That history says the growth rate is not stable, in either direction. I am not covering competition, regulation or the ad-measurement questions here, because our database has nothing that measures them, and I would rather leave a hole than fill it with speculation.
The revenue line I would hold it to
The number I would watch in the next report is quarterly revenue growth in the next report. It has fallen from 68% to 53% over four quarters. If it prints 45% or higher while the operating margin stays above 70%, the arithmetic above has room to spare, since even the 15x case needs under 10% EPS growth a year. If it drops toward 35% with margin slipping, the market will start pricing something worse than the 10% needed, and the stock could be cheaper on earnings and still be falling.
Financial disclaimer: The content on StockVane is for educational and informational purposes only and should not be construed as professional financial advice. Stock market investing involves risk of loss.
Sources: Price-to-earnings ratio (SEC Investor.gov glossary) (https://www.investor.gov/introduction-investing/investing-basics/glossary/price-earnings-pe-ratio) · Earnings reports (SEC Investor.gov glossary) (https://www.investor.gov/introduction-investing/investing-basics/glossary/earnings-report)