
Add up Spotify’s operating income for fiscal 2020 through 2023 and you get a loss of $1.31 billion. Add up 2024 and 2025 and you get a profit of $3.56 billion. Two years erased four, and then some.
That arithmetic is the reason the headline “Spotify finally turned profitable” is fair. It is also the reason I would not stop reading there. A company that reversed a six-year pattern in two years has only shown the reversal, not that it holds. The StockVane quant grade on the stock is D, and I take that as the market-facing version of the same caution: profit has arrived, proof of durability has not.
My view is that the profit is real and the margin structure is better than it was, but at $509 the stock already prices most of that, and the next few prints have to show margin still climbing, not just revenue growing.
Four years around zero
The financials page tells the story in one row. Operating income was -$0.29 billion in 2020, +$0.09 billion in 2021, -$0.66 billion in 2022 and -$0.45 billion in 2023. Revenue over that stretch grew from $7.9 billion to $13.2 billion. Sales rose by about two thirds and the company never once kept meaningful money from it.
Then the line broke. Operating income reached $1.36 billion in 2024 on revenue of $15.7 billion, a margin of 8.7%. In 2025 it reached $2.20 billion on $17.2 billion, a margin of 12.8%. Net income followed: $1.1 billion in 2024 and $2.2 billion in 2025.
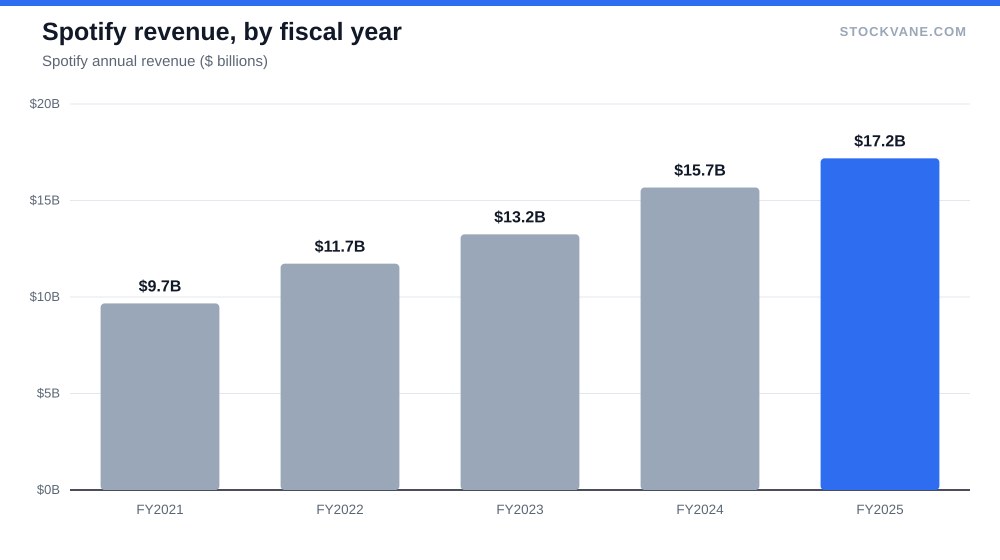
Revenue growth actually slowed while this happened. It was 18% in 2024 and 10% in 2025. Profit more than tripled between 2023’s loss and 2024’s gain, while sales grew by a fifth. So this was not a growth story that finally scaled. It was a cost and mix story.
Where the margin came from
Gross margin is the cleanest evidence. It was 25.6% in 2023, 30.1% in 2024 and 32.0% in 2025. Six and a half points of gross margin in two years, on a business that sells one recurring product, is not noise.
The segment table explains part of it. In the June quarter of fiscal 2026 the Premium subscription line brought in $4.33 billion, or 90.7% of revenue, and the ad-supported tier brought in $0.45 billion, or 9.3%. Subscriptions carry the profit. The free tier is a funnel with an ad business attached, and a subscription-heavy mix lifts the blended margin whenever Premium grows faster than ads.
I read the operating margin path this way: the first step, from -3.5% in 2023 to 8.8% in 2024, came from cutting spending that was not producing return, and the second step, to 12.8%, came from gross margin and fixed costs spread over a larger base. The first step is a one-time reset. It cannot repeat. Only the second kind is the sort that a skeptic should want to see continue.
The latest quarter adds a data point in the right direction. Revenue was $4.8 billion, up 14% from a year earlier and 5% from the prior quarter. Annualized, that is $19.1 billion, already 11% above the full 2025 figure. Growth accelerated from the 10% annual pace. That matters more than any margin figure, because it means the margin gain did not come from starving the top line.
Compare the size of the two steps in dollars. Between 2023 and 2024 operating income improved by $1.81 billion. Between 2024 and 2025 it improved by $0.84 billion. The second step is less than half the first, and that is what a fading reset looks like if you are pessimistic. It is also what a company looks like once the easy savings are gone and the rest has to come from selling more at better prices. I think the truth is somewhere between, and the next two quarters will settle which reading is closer.
What the quant grade is saying
The StockVane quant score for Spotify was 51 on September 14 and 5 on September 21. The letter grade was D both times, so the label did not move. The number under it collapsed in a week.
I do not attribute the drop to any single event, and the database gives me no news item that explains it. What I can say is what it fits: a stock that is 31.2% below its 52-week high of $740, trading 26% above its low of $405, with the recent earnings reactions pointing in different directions. Since 2025 the reported earnings-day moves have been +14.7% in February, -2.2% in November, -12.4% in April and -1.7% in August. The average absolute move is 7.8%, so the market has treated each report as a real test, and it has not consistently passed them.
Here is the opposing evidence, and it is strong. Twenty-two analysts cover the stock, 82% rate it a buy, and none has a sell. The average target is $615, 21% above the price. Even the lowest target, $525, sits 3% above it. If the quant model is too cautious, the analyst community is the counterweight. I give the analysts more weight on the business and the model more weight on the price, because the model is looking at what the stock has been doing and the analysts are looking at what the company might earn.
What you are paying
The valuation is not cheap and it is not extreme. On the snapshot the trailing P/E is 27.9 and the forward P/E is 33.7. Forward being higher than trailing is unusual. It means the forward earnings figure, $15.13, sits 17% below the trailing $18.26. I would not build a thesis on that gap. Per-share figures in the database do not line up neatly: fiscal 2025 diluted EPS is $10.51 and the quote header shows $12.06, so the safer anchor is the margin data above and not any one EPS number.
The price-to-sales ratio is a cleaner read. It is 5.3 now against a five-year average of 4.1, a band of 2.1 to 6.0 and the 74th percentile of that band. The industry average in the same data is 8.5, so on sales the stock is not out of line with peers. Price-to-book is 11.4 against 13.1 on average. The five-year average P/E of -22.3 is meaningless because the loss years drag it negative. It is one of the few numbers in the database I would tell you to ignore.
The valuation tab has the full bands. The point is that the stock sits in the upper third of its own sales range, and the earnings support for that is exactly two years old. Compare that with a company whose profit record is deep and boring. Costco at 50 times earnings is a useful contrast: there the premium multiple rests on decades of steady results, here it rests on twenty-four months.
| Metric | Value | Context |
|---|---|---|
| Price (approx.) | $509.45 | 52-week range $405 to $740 |
| P/E (TTM) | 27.9x | Five-year average -22.3x |
| Price-to-sales | 5.3x | Five-year average 4.1x |
| Analyst ratings | 82% buy, 18% hold | 22 analysts; average target $615 |
Risk: the case where I am wrong
Two conditions would prove me wrong. The first is margin. If operating margin stalls near 13% or slips while revenue keeps growing, then the two-year jump was mostly a reset and the durable margin is lower than the market thinks. The second is growth. The latest quarter grew 14%, but 2025 grew 10% for the year, and a return to single digits with no further gross margin gain would leave the valuation with nothing to stand on.
A second check I would run is against the stock’s own reaction. The August report produced a move of only -1.7%, the smallest of the four listed, even though revenue had accelerated. A market that shrugs at acceleration is a market that already assumed it. That is the practical meaning of a 74th-percentile sales multiple: good news is priced, and disappointment is not.
Short interest is modest at 3.0% of float, about 3.5 days of trading to cover, so this is not a stock the bears are crowding. That cuts both ways. There is no squeeze fuel, and no sign of a large group betting on failure.
I am not covering the podcast and audiobook side, price increases by tier, or licensing costs, because the database has no line items on them and I would be guessing. A related reading on why a backlog or a booked forecast still leaves the stock exposed to timing is Oracle’s backlog post. And for a different margin problem, one going the other way, see UnitedHealth’s margin crisis.
The threshold for the next quarterly print
Here is what I would hold Spotify to. Revenue growth at or above 14% again. Gross margin at or above 32.0%, the fiscal 2025 level. An operating margin that does not fall below the 12.8% of last year. Meet all three and the D grade looks stale and the $615 average target looks reachable. Miss the gross margin line and the quant model was right to keep asking.
Financial disclaimer: The content on StockVane is for educational and informational purposes only and should not be construed as professional financial advice. Stock market investing involves risk of loss.
Sources: Price-to-earnings ratio (SEC Investor.gov glossary) (https://www.investor.gov/introduction-investing/investing-basics/glossary/price-earnings-pe-ratio) · Earnings reports (SEC Investor.gov glossary) (https://www.investor.gov/introduction-investing/investing-basics/glossary/earnings-report)