
Suppose ServiceNow grows earnings per share 20% a year. It would take about 5 years to get from the $1.85 analysts expect for the next twelve months to $4.50, the level at which today’s $135 share price would be 30 times earnings. Thirty times is still generous for software. That is the arithmetic hiding behind the title question: a multiple of 73.3 on forward earnings assumes that AI agents are already turning into revenue and margin, and that the turn lasts years.
I do not think the data can tell us whether the agents work. What it can tell us is how much the price already assumes, and what the reported numbers have and have not shown so far. The answer is more interesting than either the bulls or the skeptics allow.
What the price is asking for
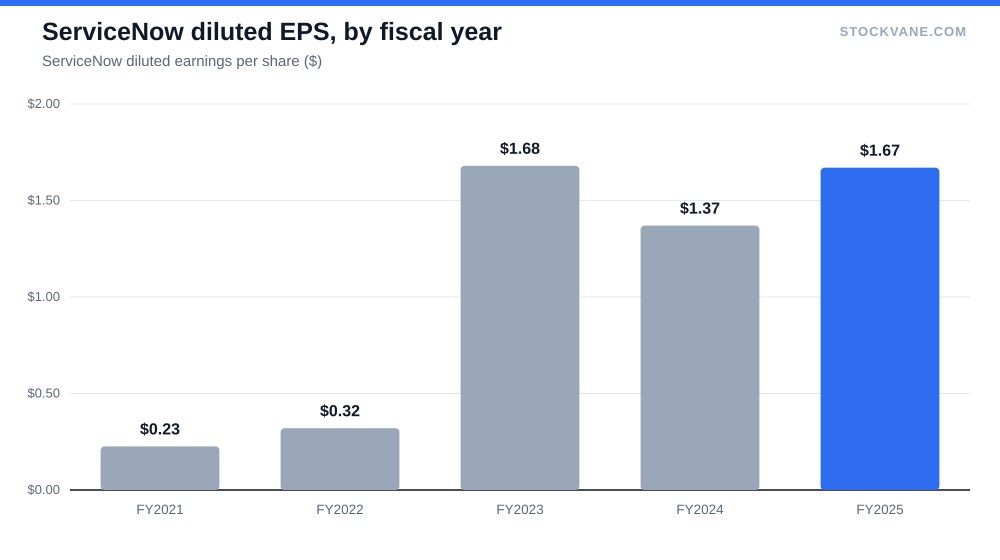
The trailing P/E is 84.7, on trailing EPS of $1.60. On forward earnings the multiple is 73.3. Software as a group averages 26.4 in our data. So the market pays roughly three times the sector multiple for a company whose expected earnings growth is 16%. I would call that a premium of something like a decade of compounding, paid in advance.
The five-year average P/E of 228.1 makes the stock look cheap on a chart, and I would not lean on it. Net income jumped 433% in fiscal 2023, from $0.33 billion to $1.73 billion, while operating income rose 117%, from $0.35 billion to $0.76 billion. A gap that wide between the two lines says net income was inflated by something outside operations, and a one-time boost like that distorts every average built on it. I read the stock as expensive on earnings. On revenue it looks more reasonable: price to sales is 9.8 against a five-year average of 15.3, and 8.2 on forward sales. On the valuation tab that sits at the 12th percentile of its own range.
A retailer with a software multiple is the obvious warning, as we found in Costco at 50 times earnings. Why do the two lenses disagree here? Because earnings are still small next to revenue. Net income was $1.7 billion on $13.3 billion of revenue, a net margin of 13%. At a 13% margin, the sales multiple is an earnings multiple in disguise.
Margins moved first
The most solid thing in the record is the margin. Operating income divided by revenue was 4.4% in fiscal 2021, 4.8% in 2022, 8.5% in 2023, 12.4% in 2024 and 13.7% in 2025. Revenue over the same stretch went from $5.9 billion to $13.3 billion. That is four years of expansion with no reversal, and it began before agents became the headline in the product pitch.
I use operating income over revenue here, 13.7%. The database’s own EBIT margin for the same year is 17.2%, which comes from a different definition of the operating line, so do not compare the two.
The trend is also flattening. The margin gained 4.0 points in 2023 and 3.9 points in 2024, then 1.3 in 2025. Meanwhile gross margin fell from 79.2% to 77.5% in 2025, the first decline in the five years of data I looked at. I cannot say why. One reading is that running AI features costs real compute and the cost is arriving in cost of revenue. That is an inference, not something the database shows, and the company would have to break it out for me to be sure. If the reading is right, then agents are dilutive to gross margin before they help revenue, which is the opposite of what a multiple of 73.3 assumes.
Growth: steady, and just starting to accelerate
Revenue grew 21% in fiscal 2025, after 22% in 2024, 24% in 2023 and 23% in 2022. The company is at $13.3 billion of revenue, holding a 20%-plus growth rate for four years. Few companies of that size manage it.
The quarterly sequence is the part bulls will point to. Year-on-year growth was 22%, 21%, 22% and then 24% in the latest quarter, when revenue reached $4.0 billion. It was up 6% from the prior quarter. The annualized run rate is $15.9 billion. One quarter of acceleration from 22% to 24% is a small signal, and I would not call it a trend. If you want to test whether agents are already showing up, this is the line (compare how Oracle’s backlog is being read, with the same demand for proof), and one more quarter at 24% or better would begin to make the case.
Compare that with what the multiple implies. Growth of about 21% and EPS growth of 16% are the numbers that support 73.3 times forward earnings. The ratio of the multiple to growth is around 4.7, well above the 1.0 that people use as a rough marker of fair pricing. Getting to a comfortable ratio would need either a lower price or faster earnings growth than the estimates show. It is a rough test and it flatters slow growers, but I would still want to see the ratio narrow.
The counter-case and the risk to my view
| Metric | Value | Context |
|---|---|---|
| Price (approx.) | $135.47 | 52-week range $81 to $195 |
| P/E (TTM) | 84.7x | Five-year average 228.1x |
| Price-to-sales | 9.8x | Five-year average 15.3x |
| Analyst ratings | 90% buy, 3% hold | 29 analysts; average target $142 |
The strongest argument in favor is that the market has already punished the stock. It trades at $135, 30.4% below the 52-week high of $195, and only 67% above the low of $81. Earnings reactions have been harsh: -17.7% after the April 2026 report, -9.9% in January, +2.5% in October 2025 and -3.7% in July. The average one-day move is 8.5%. A stock that sells off that hard on reports has already been marked down for disappointment. The forward multiple is well below where the trailing one sits, which some read as the market pricing in a lot of growth. I read it more cautiously, because it shrinks only if the earnings arrive.
The risk to my skeptical reading is concrete: if revenue growth holds at 24% or better and margins keep rising, the multiple compresses through earnings growth instead of a falling price, and I would be wrong to stay away. The other side of it is that a lower price is not the same as a low price. At 84.7 times trailing earnings, a 30% drop from the high still leaves the stock above the software average by a wide margin. The quantitative score in our system slid from B to D in the last few weeks, which means the momentum and valuation inputs deteriorated together.
Analysts do not disagree loudly. Of 29 covering the name, 90% rate it a buy. The average target is $142, which is 5% above the price, and the range runs from $72 to $248. When 90% of analysts say buy and the average target sits within 5% of the price, the consensus is bullish on the business and neutral on the stock. Short interest is 2.9% of float, so nobody is betting hard against it either.
Other AI premiums for comparison
ServiceNow is one of several stocks where the market pays now for growth it has not yet seen. Our look at Oracle’s backlog considers a company whose contracted revenue is already booked and asks the stock to prove it. In Palantir the valuation math only works under demanding assumptions. And Costco at 50 times earnings shows what happens when a low-margin retailer gets a software multiple, which is the closest thing to a warning I can offer.
The strongest counterweight is Alphabet, a giant AI spender that our data shows as the cheapest of the big technology names. Same theme, a different price. That contrast is the strongest argument that the multiple, and not the technology, is what you are being asked to underwrite.
What I am not covering
I have no customer data on agent adoption, no contract counts and no breakdown of AI-related revenue. The company reports a single segment, so the database cannot separate agent revenue from the rest of the platform. Anyone telling you agents are already working, or not, from this dataset is guessing. I also skipped a discounted cash flow model. It would give a precise number that hides how much depends on the terminal margin, and I would rather show you the arithmetic in plain view.
If I wanted exposure, I would not buy the shares at this multiple. I would think about selling a put well below the market, near the lower half of the 52-week range, and accept that I might never get assigned. That approach gets paid to wait, which suits a stock where the evidence is still arriving. It is a way to think about position sizing, not a recommendation for you.
What agents would have to show in the next report
Three numbers would move me. First, revenue growth of 24% or better again, which would turn one good quarter into a pair. Second, gross margin at or above 77.5%, which would tell me the compute bill is not eating the gain. Third, operating margin above the 13.7% of last year. If growth slips back to the low 20s and gross margin falls again, I would conclude the market is paying for a story before the numbers, and the stock probably has further to fall. If all three arrive, 73.3 times forward earnings starts to look like a price rather than a hope.
Gavin Thorne has invested in U.S. stocks for six years and previously worked at a large publicly traded internet company. He writes about income-oriented strategies, including cash-secured puts, and about how he reads company data. This article reflects his personal research process and is for informational purposes only. It does not constitute investment advice.
Sources: Price-to-earnings ratio (SEC Investor.gov glossary) (https://www.investor.gov/introduction-investing/investing-basics/glossary/price-earnings-pe-ratio) · Stock options tax topic (IRS) (https://www.irs.gov/taxtopics/tc427)
Good breakdown of the arithmetic, Gavin. One thing I’d add from the SaaS side: that gross margin dip to 77.5% is worth watching alongside the R&D line, not margin pressure on its own. We’ve seen the same move at a couple of the names I cover this earnings season, as companies stand up GPU capacity ahead of usage — it shows up as a cost-of-revenue drag before it shows up as a feature anyone’s paying for. If that’s what’s happening here, the margin should stabilize once agent usage scales into the capacity instead of keep sliding. If it falls again next quarter too, that’s a worse story — it means the compute cost is structural, not a one-time ramp. Worth flagging the company doesn’t break out agent revenue separately, so we’re all reading the same tea leaves on this one.
The cash-secured put framing at the end is the part I’d push on a little. Selling a put near the lower half of the 52-week range on a name this volatile means collecting a fat premium — implied vol on anything pricing in 70+ times forward earnings isn’t cheap — but it also means parking enough cash to actually take 100 shares at that strike if it gets there, and on a stock this size that’s real capital sitting idle for the life of the contract. I run this strategy on compounders I cover, and it only works for me when I’d genuinely be happy owning the stock at the strike, not just happy collecting the premium. At a 73x multiple I’m honestly not sure I’d be happy owning ServiceNow even at a lower strike. Good writeup regardless — the margin trend data is the most useful part of this for me.