
The most bearish analyst covering S&P Global has a price target of $500. The stock trades at $405. So the lowest opinion on the Street sits 23% above the market, and all 17 analysts, 100% of the group, rate the shares a buy.
I distrust a range like that. A stock can deserve it, and this business is a good one, but a room where nobody disagrees has stopped supplying information. If the case for owning S&P Global is already in every model, the useful question is what is not in them.
My answer, after going through the numbers: the franchise is real, the margin has not fully recovered from its 2022 break, and the shares trade 37% below their own five-year P/E for a reason the buy ratings do not discuss. I still think the stock is worth owning, but at a smaller size than a 100% buy rating implies.
The scar behind the unanimous rating
Start with the margin. Operating income divided by revenue, from the financials tab, was 48.4% in FY2020 and 50.7% in FY2021. Then 27.0% in FY2022. The company lost 24 points of margin in a single year.
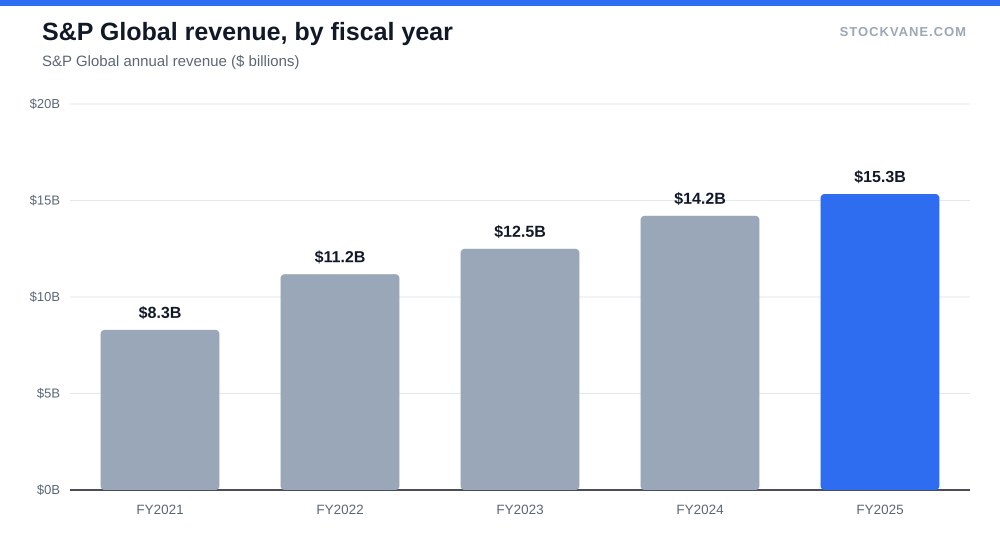
Revenue that year rose 35%, to $11.18 billion from $8.30 billion, which fits the closing of the large IHS Markit merger around then. A lower-margin data business joined higher-margin ratings and indices, and integration costs landed on top. That is my inference from the timing; the database gives the margin and the revenue jump, not the accounting behind them.
The recovery since has been steady: 32.4% in FY2023, 38.6% in FY2024 and 40.3% in FY2025. Four years after the break, the company is still 10 points short of its FY2021 margin. The database carries a separate EBIT margin, 42.5% for FY2025, which is higher because it treats some items differently; I use operating income over revenue throughout, so the figures are comparable across years.
A recovery that is roughly four-fifths finished is still a recovery. Measured against the 2021 margin, the company has regained 13 of the 24 points it lost. But the last 10 points are the expensive ones, and the analysts’ models assume they arrive.
Growth that came from the deal, then slowed
Revenue has doubled since FY2020: 106% higher at $15.3 billion in FY2025 against $7.44 billion. Most of that came in one year, 2022. Since then growth has run 12%, 14% and 8%, a slowing sequence. The latest quarter, reported July 28, brought $4.1 billion of revenue, 10% above a year earlier and -1% below the prior quarter. Revenue growth of 10% on a business with a 70% gross margin (70.2% for FY2025, 69.1% for FY2024) is respectable and unremarkable.
Earnings per share tell the same story with more drama. Diluted EPS was $9.66 in FY2020, $12.51 in FY2021, $10.20 in FY2022, $8.23 in FY2023, $12.35 in FY2024 and $14.66 in FY2025. The five-year gain is 52%, and two of those years, FY2022 and FY2023, were down. A reader who looks only at the last two years sees a compounder, with EPS up 50% and then 19%. Extend the window back to FY2021 and the stock has produced $14.66 against $12.51 in three years, a gain of about 17%, which is a pace that supports a 25 times multiple without leaving room to celebrate. A reader who looks at all six sees a company that took a step back to take a step forward.
Where the revenue comes from
The June 2026 quarter split into five reporting segments. Ratings brought in $1.34 billion, 32% of the total. Market Intelligence brought $1.29 billion, 31%. Energy ($0.57 billion), Indices ($0.53 billion) and Mobility ($0.47 billion) made up most of the rest.
The point is diversification: no segment is a third of sales. Ratings is the piece people think of as a toll road, since issuers generally need a rating to sell debt, and it is widely understood to carry the fattest margin in the group. The remaining four segments sell data, analytics and benchmarks, mostly on subscription, which steadies revenue while leaving it exposed to budget cuts at the customer. The others are data subscriptions with the usual renewal risk. If Ratings slows because bond issuance slows, the group has a cushion; if the subscription businesses slow, it does not, because the cost base does not shrink with them.
I cannot see segment margins in our data, so I will not guess which segment carries the profit. The Visa post makes a similar toll-road argument for payments, and the same caution applies here: a toll road is only as good as the traffic.
What the stock is priced for
The price is $405, 21.9% below the 52-week high of $519 and 13% above the low of $358. Market value is $119.5 billion. On the valuation tab, the trailing P/E of 24.7 sits at the 5th percentile of its own five-year range of 29.5 to 48.9, against an average of 39.2. Price-to-sales is 7.4, below a five-year average of 11.1 and at the very bottom of its range.
That looks cheap, and I suspect the buy ratings are largely a reaction to it. A multiple in the bottom five percent of its own history is the kind of signal that pulls value-minded analysts and growth-minded analysts to the same conclusion for different reasons, which is one way a unanimous rating can form without anyone being careless. Twenty-nine percent to the average target of $523 is the upside they see. Yet two things temper the read.
First, forward EPS is $16.27 against trailing $16.43. The market’s own estimates imply earnings falling about 1% over the next year, so the multiple is barely lower on a forward basis (24.9). Twenty-five times flat earnings and twenty-five times earnings growing 15% are two very different purchases, and only the second earns a growth premium.
Second, our quant score is E, in the bottom decile, down from C in mid-September. The model weighs momentum and estimate revisions along with valuation, so the E says the recent tape has been weak even if the price is low. I would not trade on it alone, and I would not ignore it while every analyst sits on the same side of the boat.
| Metric | Value | Context |
|---|---|---|
| Price (approx.) | $405.32 | 52-week range $358 to $519 |
| P/E (TTM) | 24.7x | Five-year average 39.2x |
| Price-to-sales | 7.4x | Five-year average 11.1x |
| Analyst ratings | 100% buy, 0% hold | 17 analysts; average target $523 |
| Dividend yield | 0.95% |
The table above collects the headline figures; the sections below explain how I read them and where the read could fail.
The case for unanimity
To be fair to the analysts, there are real reasons to agree. Operating income rose from $4.05 billion to $5.48 billion to $6.2 billion over the last three years, and net income reached $4.8 billion in FY2025, up from $4.2 billion. A net margin of 31% is exceptional. A business that earns 31 cents net on every revenue dollar has room to absorb a bad year.
There is also a dividend, small but growing: 0.95% at $3.86 a year in the trailing period. It cannot carry the thesis by itself, though it does signal cash confidence.
So I do not think the analysts are wrong about the business. My objection is to what a unanimous rating does to the price: it removes the buyers who have not yet bought, since everyone who wanted to has, and leaves the stock exposed to any single disappointment. The last two reports produced moves of -3.5% and about -0.9%, both down. The average earnings-day move is 4.5%, which is small, so this is not a stock that punishes hard, but it has not been rewarding good news either.
What I am not covering
A post can only be honest about what it leaves out if it says so. Here is my list.
Three things are outside this post. I have not modeled the ratings business against bond issuance, because our database does not carry issuance data. I have not compared S&P Global with its direct rivals, since I lack comparable figures for them here. And I have not sized the merger’s synergy claims, which management sets and our data cannot test.
For a similar exercise on another crowded trade, see what happens when everyone is bullish on Apple, and for the mechanics of reading these reports, the earnings report guide. Short interest is 2.4% of float, about 4 days of volume to cover, so nobody is positioned against the consensus in size.
The 40% margin test
I would hold the stock to one number. Operating margin has climbed from 32% to 40%, and the buy case needs it to keep moving toward the 50% the company earned before the merger. If the next annual report shows it below 40% with revenue growth still near 8%, the recovery has stalled, the forward P/E of 24.9 is not a discount, and a 100% buy rating will look like a room that stopped checking. If it prints above 42% on growth of 10% or more, I will accept that the analysts had it right and this was a rare case of unanimity that deserved to be there.
Gavin Thorne has invested in U.S. stocks for six years and previously worked at a large publicly traded internet company. He writes about income-oriented strategies, including cash-secured puts, and about how he reads company data. This article reflects his personal research process and is for informational purposes only. It does not constitute investment advice.
Sources: Dividends (SEC Investor.gov glossary) (https://www.investor.gov/introduction-investing/investing-basics/glossary/dividend) · Dividends tax topic (IRS) (https://www.irs.gov/taxtopics/tc404)