
Since August 2025 Applied Materials has risen from about $160 to $444.57, a gain of 2.8 times. Trailing earnings per share over the same stretch rose 34%, from the $8.66 of fiscal 2025 to about $11.59. Most of the stock’s move came from the multiple, not from the business, and the last three months have been the market taking some of it back.
That is the frame I would use for this stock now. The shares peaked in June, and at $444.57 they trade 40% below the 52-week high of $738.88 and 132% above the low of $191.37. Behind that swing is a real acceleration in sales. My view is that the fundamentals have earned a higher price than August’s, and that the current one already assumes the acceleration continues for another year or more. I will show where I think that leaves the stock.
Sales finally moved
The financials tab shows the slow years first. Revenue was $25.8 billion in fiscal 2022 and $28.4 billion in fiscal 2025, three years of low single-digit growth. Net income slipped 2.5% in 2025 to $7.0 billion. Nothing in that record justified a 38 multiple.
The quarters changed the picture. The fiscal fourth quarter of 2025 brought in $6.80 billion, down 3% from a year earlier, and the first quarter of fiscal 2026 $7.01 billion, down 2%. Then $7.91 billion in the second quarter, up 11%, and $9.12 billion in the quarter reported on August 13, up 25%. From the first quarter to the third, revenue rose 30% in two quarters.
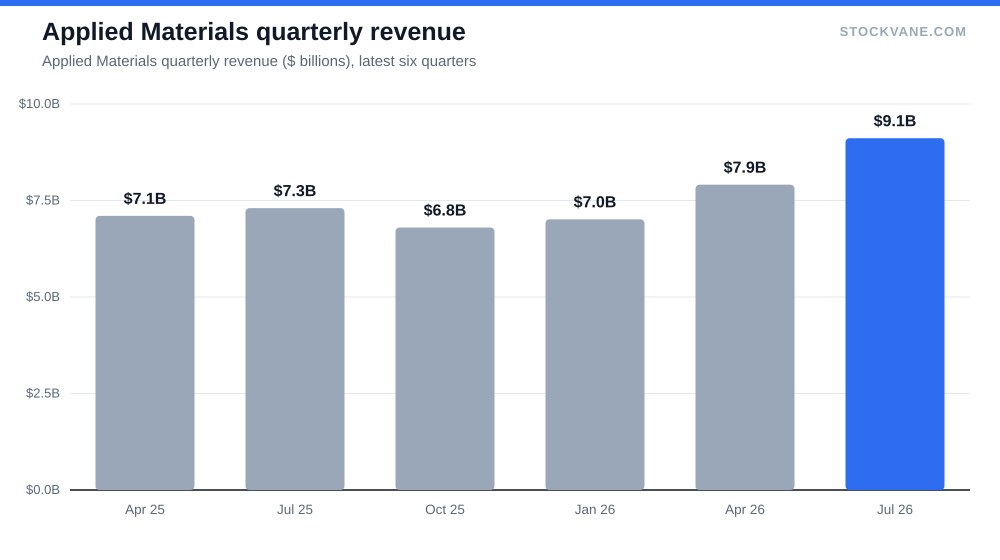
Profit followed. Third-quarter net income was $2.54 billion, up 43% on the year, a 28% net margin. The second quarter earned $2.81 billion on $7.91 billion, a 35% margin, which looks like an unusually good quarter to me, and I cannot tell from our data whether it included a one-time item. Over the last four quarters, net income adds up to about $9.27 billion on $30.8 billion of sales, or 30%. That compares with $7.0 billion of net income in fiscal 2025.
Where the sales come from
Semiconductor Systems, the equipment that goes into chip factories, made $7.04 billion of the latest quarter, 77% of the total. Applied Global Services, the maintenance and upgrade business, made $1.78 billion, 20%. That split matters, because equipment orders track customers’ capital budgets and swing hard, while the services line is steadier work on machines already in the field.
Nothing in our data separates the two by growth rate, so I cannot say how much of the 25% increase came from new tools. I would guess most of it, given how flat the prior year was, but I flag that as an inference. If it is right, the acceleration depends on chipmakers keeping their spending up, the same dependence covered in our look at the AI capex cycle.
The multiple did most of the work
The valuation tab puts the trailing P/E at 38.4 on the snapshot. The valuation panel shows 36.8, above the top of its five-year band of 13.7 to 32.4 and well above the five-year average of 23.0. Price to sales is 11.0, against an average of 5.9. Price to book is 13.2, against 9.3.
The forward P/E of 24.4 is where the bulls make their stand. It implies about $18.23 a share over the next twelve months, 57% above the $11.59 trailing figure. The industry average forward-looking multiple on the site is 45.7, so on that scale Applied Materials looks cheap next to its group. I do not trust that comparison very far, because the group includes companies with much steeper growth. Still, it is a genuine point in the stock’s favor.
So the same stock is expensive against its own history and cheap against its peers. Both are true. Which one matters depends on whether the earnings estimate of $18 is right, and that estimate needs profit to keep growing at something like the recent quarterly pace.
What the price implies
| Earnings basis (EPS) | 23.0x | 24.4x | 45.7x |
|---|---|---|---|
| Fiscal 2025 ($8.66) | $200 | $211 | $396 |
| Trailing 12 months ($11.59) | $267 | $283 | $529 |
| Forward estimate ($18.23) | $420 | $445 | $833 |
At the current price the market is paying the 24.4 times forward multiple on $18.23 of earnings. The grid shows what happens if either input moves. Trailing earnings at the five-year average multiple of 23.0 give about $267, 40% below today’s price. The forward estimate at that same 23.0 gives $420. At the industry’s 45.7 times, the forward estimate would be $833, above the 52-week high, which is a reminder of how much room a rich group multiple leaves and how little I would count on it.
The lesson I take is asymmetry. The stock can hold today’s price only if the earnings estimate arrives, and it needs that estimate plus a multiple near what it already has. If earnings arrive but the multiple falls toward the five-year average, the price is roughly flat to down. If earnings miss, the drop is larger.
The run-rate test
Here is a check I find more useful than the multiple. The latest quarter earned $2.54 billion. Multiplied by four, that is $10.2 billion a year. The stock’s market value of $353 billion at this price implies about 0.79 billion shares, so the run-rate works out to roughly $12.8 a share, well short of the $18.23 the forward multiple assumes.
To reach $18.23, net income has to average about $3.6 billion a quarter over the next twelve months, against $2.54 billion now and $2.81 billion in the peak second quarter. That takes more than another year of 25% growth. It takes a faster ramp or a wider margin than the record so far. Analysts may see order books I do not, and the estimate could be right. I would still call it the hardest single number in the case, and it is the one I would want a bull to explain.
What analysts and the score are saying
Of the 27 analysts, 89% rate it a buy and none a sell. The analyst page shows an average target of $692, 56% above the price, with a low of $585, 32% above, and a high of $900, 102% above. Even the most cautious target sits well above today’s price. Given that the stock fell 38% from its June level, I read that as analysts anchoring on earnings while the market reprices the multiple.
Our quant score reads B at 95, up from C at 58 on September 8. That is a fast move, and the stock rose 6.5% on the day of the latest snapshot. I have no news for the jump and will not guess at one. Short interest is 2.0% of float as of August 31, low.
| Metric | Value | Context |
|---|---|---|
| Price (approx.) | $444.57 | 52-week range $191 to $739 |
| P/E (TTM) | 38.4x | Five-year average 23.0x |
| Price-to-sales | 11.0x | Five-year average 5.9x |
| Analyst ratings | 89% buy, 11% hold | 27 analysts; average target $692 |
| Dividend yield | 0.43% |
Reports have not moved the shares consistently. The last four earnings days were -5.1%, -0.9%, +8.1% and +1.2%. The report that showed the strongest growth of the four, 25% revenue growth, was the one that fell 5.1%. A stock priced at 38 times earnings can fall on excellent numbers when the numbers were already in the price.
The counter-case to my caution is simple. If chipmakers are pulling equipment purchases forward, the next few quarters could beat every number above, and a stock at 24 times forward earnings would look cheap in hindsight. I cannot rule that out. What I can say is that the price already pays for a good part of it, and that a stock which lost 38% between June and now has shown how quickly the market changes its mind about the multiple.
Peers and what I did not check
Applied Materials is one of several toolmakers riding the same spending. Our piece on ASML covers the company with the most concentrated position in leading-edge lithography. I have not compared Applied Materials with its closest US peers on growth and margins here, because I did not pull their data for this piece, and the old claim that they are compounding faster is one I could not verify. Treat that comparison as unverified.
What I can add is a note on quality. Gross margin rose from 45% in fiscal 2020 to 49% in fiscal 2025, and operating margin was 30% of sales in fiscal 2025. Morningstar, whose analysis we carry on the quote page, gives the company a wide moat on intangible assets and switching costs. That is a good business by any measure I have. The debate is price.
The October report and the $9.1 billion line
The dividend is $0.53 a quarter, 15% above the $0.46 paid in February, a yield of 0.43%, and I would not buy the stock for it. What I would watch is one number. If revenue in the quarter that ends in October holds at or above $9.1 billion, the acceleration has lasted three quarters and the $18 estimate looks reachable. If it falls back toward $8 billion, the forward multiple of 24.4 is applied to an earnings number that was too high, and the low target of $585 will be the level that stays above the price the longest.
Until that report I would not add at $445. Below about $420, where the forward estimate at the five-year average multiple sits, the arithmetic starts to give something back.
Financial disclaimer: The content on StockVane is for educational and informational purposes only and should not be construed as professional financial advice. Stock market investing involves risk of loss.
Sources: Dividends (SEC Investor.gov glossary) (https://www.investor.gov/introduction-investing/investing-basics/glossary/dividend) · Dividends tax topic (IRS) (https://www.irs.gov/taxtopics/tc404)