
JPMorgan’s record close is $365.18, set on August 12, and its all-time intraday high of $366.50 came the next day. On September 18 the shares closed at $349.67. That is 4.6% under the peak, so the title needs a footnote: the stock is no longer at a record, though it was within four percent of one when this was first written and the question in the headline survives the pullback. What are you paying for at 15.0 times trailing earnings?
The number itself looks harmless. Fifteen times earnings sounds like a bargain next to the market at large. But it sits against a five-year average of 11.9 for JPMorgan itself, which puts today’s multiple 26% above its own norm and in roughly the 89th percentile of its five-year range. The bet at this price is that the earnings behind the multiple are durable, and that is a bet about where a very cyclical income statement goes next.
How far it has slipped, and who else slipped
Start with the pullback, because it is less about JPMorgan than it looks. From the August 12 record close of $365.18 to $349.67, the stock lost 4.2%. Over the same weeks every other large bank we track fell further: Bank of America -11% below its 52-week high, Citigroup -10%, Wells Fargo -10%, Morgan Stanley -12%, Goldman Sachs -18%. JPMorgan is 4.6% off its high against an average of 12% for those five.
I read that as the market still paying up for quality within a group it has started to doubt. It is a relative statement, not a cheap one. A stock that falls 4.6% while its peers fall 10% to 18% has kept its premium, and the premium is the thing to examine.
Over a longer stretch the stock has done fine. A year ago, on September 18, 2025, it closed at $307.35, so the shares are up 13.8% since. Since the first trading day of 2026 the gain is 9.0%. Nothing here looks like a stock in trouble. It looks like a stock that has already been paid for a very good stretch of results.
The multiple against its own history, and against peers
Three valuation gauges on the JPMorgan valuation page tell the same story. The trailing P/E is 15.3 against a five-year average of 11.9. Price to sales is 4.7 against 3.7. Price to book is 2.7 against 1.9, which is the largest stretch of the three: 42% above its own average, in the 98th percentile of its five-year history. For a bank, book value is the anchor, so the price-to-book reading is the one I would give the most weight.
Against peers the picture is more mixed than the headline suggests, and here is where a fair reader should push back on me.
| Bank | Price | Trailing P/E | Price to book | 52-week high | Vs. high |
|---|---|---|---|---|---|
| JPM | $349.67 | 15.0 | 2.63 | $366.50 | -4.6% |
| BAC | $57.73 | 13.3 | 1.46 | $64.89 | -11.0% |
| C | $131.77 | 14.2 | 1.15 | $147.21 | -10.5% |
| WFC | $86.12 | 12.5 | 1.58 | $96.18 | -10.5% |
| GS | $942.00 | 14.6 | 2.50 | $1,148.37 | -18.0% |
| MS | $202.58 | 16.4 | 2.99 | $230.98 | -12.3% |
On trailing earnings JPMorgan at 15.0 times is roughly in line with the five other banks in the table, whose average is 14.2. Goldman trades at 14.5 times, Citigroup at 14.2. Only Morgan Stanley, at 16.4, is higher. The premium shows up on the balance sheet side: JPMorgan’s price to book of 2.6 compares with about 1.5 for Bank of America and Wells Fargo and 1.1 for Citigroup. Investors will pay more per dollar of book for JPMorgan because it earns more on that book. The arithmetic only holds while it keeps doing so.
That is the counter-case, and it is a serious one. A bank that earns a high return on equity deserves a higher multiple of book. If JPMorgan’s returns stay where they are, 2.7 times book is defensible. The problem is that this argument gets weaker exactly when the earnings cycle turns, and that is when the price-to-book multiple would be tested.
What the earnings say
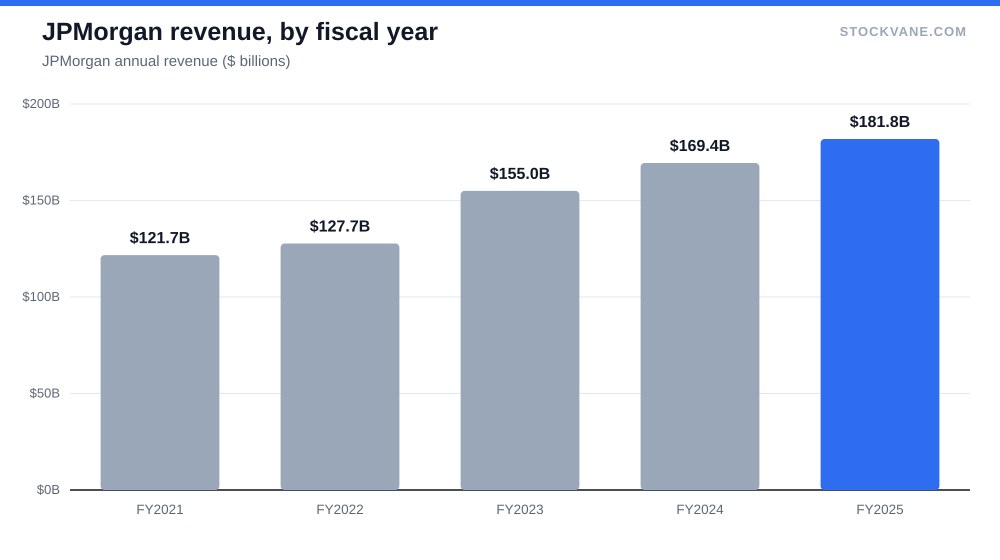
Revenue for the second quarter of 2026 was $52.9 billion, up 18% from a year earlier and 6% from the first quarter. Annualize that quarter and you get $211.4 billion, well above the $181.8 billion the bank booked in fiscal 2025. The business is running hot. The second-quarter results on July 14 drew a modest reaction of +2.5%, against an average earnings-day move of 2.4%, so the market shrugged at a very strong number. When a stock does not rally on a quarter like that, expectations were already high.
The detail that matters more is what this earnings line looks like in a longer series. Net income was $58.5 billion in fiscal 2024 and $57.0 billion in fiscal 2025, a dip of about 2% even as revenue grew 7%. Revenue has risen from $127.7 billion in 2022 to $181.8 billion in 2025, but net income in 2022 was $37.7 billion and in 2025 was $57.0 billion. A net margin of 31% is exceptional for a bank, and I would not extrapolate it.
Look at how analysts model the next year. Forward earnings per share come to $23.49, against trailing earnings of $23.34. That is only 0.6% higher. On those estimates the forward P/E is 14.9 against the 15.0 trailing, so the market is paying essentially the same price for next year as for this one. Growth is priced at close to zero. If that is right, the multiple has no room to compress from earnings growth catching up, and it has nothing to rely on if the numbers merely hold.
Where the profits come from
The June quarter segment split makes the concentration clear. The Commercial and Investment Bank contributed $24.9 billion of revenue, or 43% of the total. Consumer and Community Banking added $20.3 billion, or 35%. Asset and Wealth Management brought in $6.9 billion, or 12%, and Corporate $6.0 billion, or 11%.
| Metric | Value | Context |
|---|---|---|
| Price (approx.) | $349.67 | 52-week range $276 to $366 |
| P/E (TTM) | 15.0x | Five-year average 11.9x |
| Price-to-sales | 4.7x | Five-year average 3.7x |
| Analyst ratings | 67% buy, 33% hold | 15 analysts; average target $385 |
| Dividend yield | 1.72% |
The trading and investment banking business is the least predictable of the four, and it is the largest. It can produce the kind of quarter that lifts the whole company and then give some of it back. I would not assume that the same 43% share repeats through a slower capital markets year. Deposits and lending in the consumer segment are steadier but respond to the rate path, which is why the September 16 Fed decision matters for banks even though the hike itself was never the trade for the broader market.
What the crowd thinks, and where I disagree
Fifteen analysts cover the stock. Ten of them, 67%, rate it a buy, five say hold and none say sell. The average target is $385, 10% above the current price, with a range of $340 to $452. The lowest target sits 3% below the price, which means that even the most cautious analyst does not see much downside, and the highest, 29% above, comes with a Goldman Sachs adjustment to $452 on September 9.
Consensus is comfortable, and comfort at a record-adjacent price is something I treat as information. It does not mean the analysts are wrong. It does mean the distribution of views has little to offer in the way of caution, and if earnings disappoint, there is more room for targets to fall than to rise. Our own quantitative grade is a C, up from a D on September 8, which is a neutral reading and not an argument in either direction. Short interest is 1.0% of float, so nobody is positioned against the stock in size.
The income case is modest
For income investors, the yield is 1.72%, with $6.00 a share paid over twelve months. That is about what you would earn from a broad index fund and well under a Treasury bill. Nobody buys JPMorgan at this price for the dividend. It is an owner’s bet on retained earnings and buybacks. If you want the dividend to matter, the high dividend yield versus dividend growth comparison covers when a low starting yield with growth beats a high one.
A comparison with the site’s other stretched-multiple stocks is useful for scale. Costco at 50 times earnings asks for growth that the business has to deliver every year. JPMorgan asks for something different: that a cyclical earnings stream stays near a peak. Fifteen times is a much lower number, and it can still be the riskier one, because the risk is not growth but reversal.
What I am not covering
I am not modeling credit losses; I have no loan-loss provision figure I trust for the quarter, and I will not guess at one. I am also not forecasting net interest income, which depends on a rate path nobody knows. If you want to learn how to read the line items yourself, our guide on how to read an earnings report is a reasonable place to start.
The number I would hold it to
The third-quarter report is due on October 13, and the average earnings-day move is 2.4%, so a print that merely meets expectations should barely move the stock. What matters is whether trailing earnings per share, $23.34 today, can keep climbing toward the forward estimate of $23.49. If the report shows profit below that pace, then paying 2.7 times book stops being a premium for quality and becomes a premium for a peak. A new high above $366.50 would need that EPS number to have moved first; I would not chase a record made on the multiple alone.
Gavin Thorne has invested in U.S. stocks for six years and previously worked at a large publicly traded internet company. He writes about income-oriented strategies, including cash-secured puts, and about how he reads company data. This article reflects his personal research process and is for informational purposes only. It does not constitute investment advice.
Sources: Dividends (SEC Investor.gov glossary) (https://www.investor.gov/introduction-investing/investing-basics/glossary/dividend) · Dividends tax topic (IRS) (https://www.irs.gov/taxtopics/tc404)