
I run five checks before I write about a stock I might sell puts on: is revenue growing, are margins rising, is earnings power real, is the balance sheet fine, and is the price lower than it was. Netflix passes the first three. Yet the shares closed at $71.79 in our latest snapshot, 43% below the 52-week high of $124.86, and they are only 10% above the low of $65.08.
Operating margin was 29.5% in 2025, a record for the company and up from 26.7% in 2024, itself a record. Revenue grew 16% for the second year in a row. That is the profile of a healthy business, and a price that looks like the opposite.
My reading is that the business is fine and the stock is repricing growth, not health. The most recent quarter is where that shows: revenue growth slowed to 13% from 18% two quarters earlier, and five earnings days in a row ended lower. The question for a forecast is whether 13% is a floor or a step on the way down.
What the record margin is made of
Look at the financials tab. Revenue was $33.72 billion in 2023, $39.00 billion in 2024 and $45.18 billion in 2025. Operating income went from $6.95 billion to $10.42 billion to $13.33 billion, so the company converted a 16% sales gain into a 28% gain in operating profit in the latest year.
Gross margin rose from 46.1% to 48.5% over the same period, which explains 2.4 points of the 2.8-point jump in operating margin. The rest came from operating costs growing slower than sales. In 2022 operating margin was 17.8%. In 2023 it was 20.6%. Nearly twelve points of expansion in three years is the sort of result that tends to be described as durable until the growth rate slips.
Earnings per share followed: $1.98 in 2024 and $2.53 in 2025, up 28%. Net income was $10.98 billion. Trailing earnings look bigger than that, and the reason is worth a paragraph.
Net income in the quarter reported for March 2026 was $5.28 billion, 43% of that quarter’s revenue, against $3.40 billion (27% of revenue) in the June quarter. A jump of that size on flat margins is not organic. The data I use does not say what caused it, so I do not build on it. It also explains why the trailing EPS of about $3.18 sits above the forward figure of about $3.11 implied by a forward P/E of 23.0. When forward earnings are below trailing earnings, some of the trailing number is not going to repeat.
Growth is slowing, and the market noticed
Quarterly revenue was $11.51 billion, $12.05 billion, $12.25 billion and $12.56 billion in the last four reported quarters. Year-over-year growth for the same quarters was 17%, 18%, 16% and 13%.
That sequence matters more than the annual margin. A 13% grower deserves a lower multiple than an 18% grower, and the multiple has moved accordingly. The valuation tab shows a P/E of 25.4 against a five-year average of 40.2, at the 15th percentile of its own history. The stock did not become a bad business in 2026. It became a slower one, and slower businesses get priced on a different curve.
Earnings-day reactions show it. The last five reports moved the stock -7.3%, -9.7%, -2.2%, -10.1% and -5.1%, an average of about -6.9%. It is unusual to see five losses in a row from a company whose margin has been rising; I read that as buyers wanting faster top-line growth and not being paid for margin.
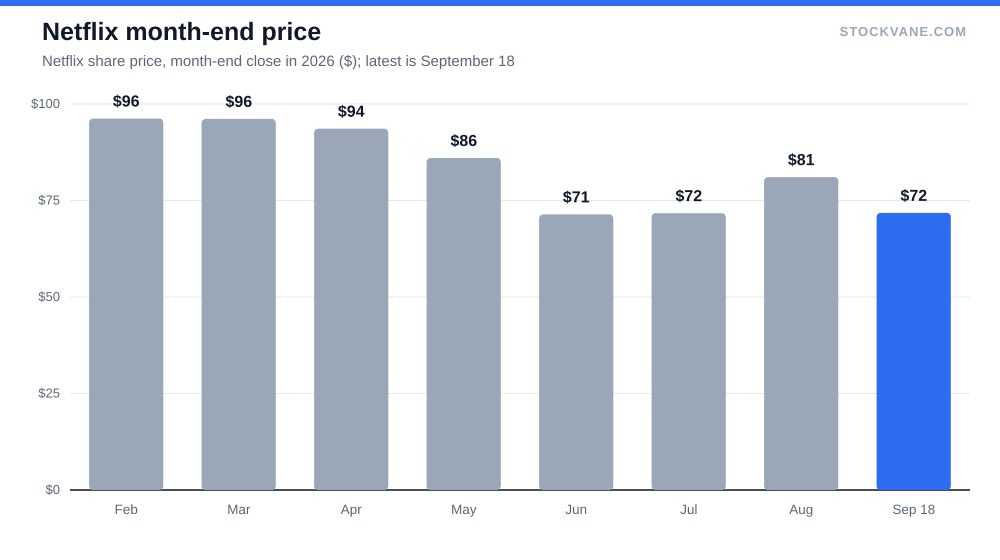
The path of the price fills in the rest. Netflix closed April at $93.61, June at $71.40, a 24% drop in two months, and August at $81.05. It is now back at $71.79, down 11% from August.
What the price implies
At 23.0 times forward earnings, the stock is priced for something in the middle. Take the forward EPS of about $3.11 and multiply by a range of P/E ratios and growth cases.
| Forward EPS Multiple | 20x earnings | 25x earnings | 30x earnings |
|---|---|---|---|
| $3.11 a share (forward estimate) | $62 | $78 | $93 |
| $3.58 a share (+15%) | $72 | $90 | $107 |
| $4.05 a share (+30%) | $81 | $101 | $121 |
The grid is arithmetic, not a forecast. At the current price the market is paying about 23 times forward earnings. To get back to the 52-week high of $124.86 at 25 times, earnings would need to reach about $4.99, which is 60% above the forward estimate. That is the size of the gap between where the stock is and where it was.
The analyst average target of $97 needs less: at 25 times, it corresponds to about $3.87 of earnings, or 24% above the forward figure. That is achievable if profit keeps growing at the pace of the last two years, and not achievable if growth keeps sliding.
Put differently, the stock has lost about $53 of value per share from its high while the business earned more. Full-year EPS rose 28% in 2025, and the shares still sit 43% below their high. Those two facts do not cancel; they show how much of the earlier price was multiple, not earnings.
Price to sales tells a similar story from a different angle. It is 6.9, against a five-year average of 7.5 and an industry figure of 2.3. Netflix has never been priced like the rest of its industry, and it isn’t now.
Thirty-two analysts, and the quant model disagrees
Of the 32 analysts on the analysts tab, 78% rate Netflix a buy and 22% a hold, with none at sell. The average target of $97 is 35% above the price. The lowest target, $75, is 4% above it, so nobody covering the stock expects it to stay here. The highest, $135, is 88% above.
Recent notes lean the same way: Evercore raised its target to $110, Citi held a buy at $100 and Bernstein started coverage with a buy at $95, all within the last two weeks. Morningstar’s fair value in our data is $80, about 10% above today’s price, and it carries a high uncertainty rating.
| Metric | Value | Context |
|---|---|---|
| Price (approx.) | $71.79 | 52-week range $65 to $125 |
| P/E (TTM) | 22.6x | Five-year average 40.2x |
| Price-to-sales | 6.9x | Five-year average 7.5x |
| Analyst ratings | 78% buy, 22% hold | 32 analysts; average target $97 |
Our own quant score disagrees. It fell from a C with a score of 55 on September 8 to an E with a score of 2 in the latest reading. Quant models weigh price momentum heavily, and a stock that dropped 11% in a month will score badly on that regardless of what analysts think. I read the E as a statement about the tape, not about the business. It does tell me that anyone buying here is buying against the trend.
Short interest is 2.2% of float, about 3.3 days to cover. Nobody is betting heavily against the company.
Morningstar, whose commentary is in our data, gives Netflix a narrow moat built on its subscriber base and its head start in streaming, and a high uncertainty rating because competitors now have their own services and consumers have more choice. I read that as consistent with the price action. A company with a real advantage and a wide range of outcomes is the kind that trades at a lower multiple when growth slows, even while it keeps earning more each year.
That is also why I would not equate a low quant score with a broken company. Fair value and price sit within about 10% of each other; the fight is over whether the next three years look like the last three.
The counter-case
The bull case in this note assumes revenue growth stabilizes near 13%. If it falls to 10% or lower, the multiple has more room to compress, and neither margin nor buybacks fixes that. I do not have subscriber data or content spending in the tables I use, so I cannot say whether the slowdown reflects saturation, competition, pricing or a tougher comparison. I can only say what the numbers do.
Margins are the second risk. Twenty-nine and a half percent is a record, and records are hard to defend. If content or advertising costs climb faster than sales, operating margin gives back some of the twelve points and earnings growth would be lower than sales growth.
I am also not covering the March-quarter spike in net income beyond flagging it. If it turns out to be a recurring stream and not a one-time item, the trailing figures look better, and the stock looks cheaper than I have described.
For an income-minded reader, I would add that the stock pays no dividend, so the return here is entirely price. That changes how I would think about a cash-secured put: the strike I would consider sits below the 52-week low of $65.08, which is 9% under the current price, and I would only sell one in an amount I would happily own. I have written more about how I size those in the cash-secured put guide. For a wider comparison of mega-cap valuations, see the Alphabet piece.
What the October 20 report has to show
Netflix reports its next quarter on October 20. The same quarter a year earlier brought in $11.51 billion, so 13% growth means about $13.0 billion. That is my line. At or above it, the slowdown looks like a pause and $3.11 of forward earnings is reachable. Below about $12.7 billion, which is 10% growth and barely above the latest quarter’s $12.56 billion, I would treat 13% as a step down and not a floor, and I would stay out until the price stops making lower lows.
Gavin Thorne has invested in U.S. stocks for six years and previously worked at a large publicly traded internet company. He writes about income-oriented strategies, including cash-secured puts, and about how he reads company data. This article reflects his personal research process and is for informational purposes only. It does not constitute investment advice.
Sources: Dividends (SEC Investor.gov glossary) (https://www.investor.gov/introduction-investing/investing-basics/glossary/dividend) · Dividends tax topic (IRS) (https://www.irs.gov/taxtopics/tc404)