
Pfizer went ex-dividend on November 7, January 23, May 8 and July 24, and every time the check was $0.43 a share. The profit line underneath those four dates reads $3.55 billion, a loss of $1.64 billion, $2.70 billion, and a loss of $0.24 billion. One of those series is steady. It is not the one that pays the shareholder.
That is the whole argument over Pfizer’s 6.22% yield in four numbers. At $27.66 a share the payout looks generous, and generous payouts on stocks that have gone sideways for years usually come with a question attached. My answer is that the dividend is not in danger this quarter, and it is not safe on the earnings Pfizer reported over the last twelve months either. Whether it survives depends on a cost-cutting program landing on schedule, and I will show why I say that.
What the check costs
The quote page lists a trailing dividend of $1.72 a share, four payments of $0.43. Pfizer’s market value of about $158 billion at this price implies roughly 5.7 billion shares, so the annual bill comes to about $9.8 billion, or $2.45 billion a quarter. Those are my estimates from the share count the price implies, not a figure lifted from a cash flow statement, and I will flag the gap that matters below.
Set that against profit. Pfizer earned $7.81 billion in fiscal 2025, or $1.36 a diluted share. The dividend at $1.72 is 126% of that. Cash out exceeded the year’s reported profit by about a quarter.
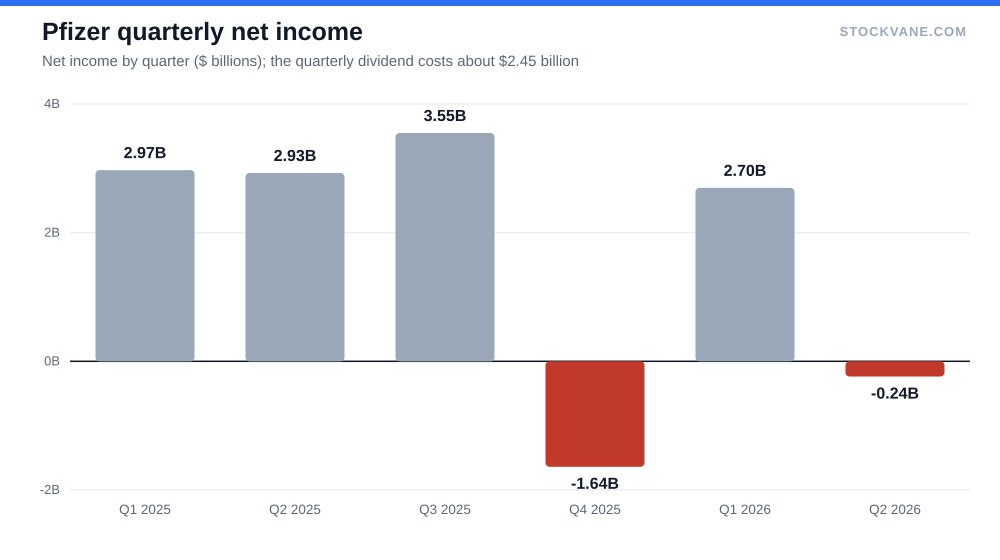
Then look at the last four reported quarters, which add up to net income of $4.37 billion. StockVane’s trailing P/E of 36.4 works out to about $0.76 a share of trailing earnings, so the payout ratio on that basis is about 226%. In four of the last six quarters, profit covered the $2.45 billion quarterly bill. In the other two it did not, because there was no profit to cover anything.
Why 36 times earnings is a distortion
A trailing P/E of 36.4 would ordinarily say the stock is expensive. Here it says something narrower: the earnings figure is temporarily damaged. The industry average on the same page is 29.6, and Pfizer’s forward P/E is 14.2. That forward multiple implies analysts expect about $1.94 a share over the next twelve months.
If they are right, the dividend is 88% of earnings. That is high but not alarming for a large drugmaker. The whole call rests on the jump from $0.76 to $1.94, which is a rebound of about 2.6 times in earnings per share, and I would not accept it on faith. I do not have the analysts’ models, so I cannot tell you which lines carry the recovery.
The business under the payout
Revenue was $101.2 billion in 2022, the Covid peak, and $59.6 billion in 2023, a 41% fall. Then $63.6 billion in 2024 and $62.6 billion in 2025. The last four reported quarters total $63.7 billion. Sales have stopped falling. They have not started rising.
The financials tab shows what did improve. Operating income was $17.4 billion in fiscal 2025, about 28% of sales, against $4.4 billion in 2023, when it was 7%. Gross margin sat at 74%. Pfizer spent $10.4 billion on research that year. So the underlying business earns money. The reported net income is what falls short, and the gap between $17.4 billion of operating profit and $7.8 billion of net income is where the argument lives: interest, taxes and, in the loss quarters, charges that I cannot itemize from our data.
Consider how the quarters have run. Fiscal 2025 revenue came in at $13.72 billion, $14.65 billion, $16.65 billion and $17.56 billion, and the first two quarters of fiscal 2026 at $14.45 billion and $15.03 billion. Against the same quarters a year earlier, that is growth of 5% and 3%, so the decline has stopped without turning into a recovery. But 3% growth on $15 billion is about $0.4 billion of new quarterly sales, which does not move a $2.45 billion dividend. The BioPharma segment made up 97.5% of the latest quarter, at $14.66 billion. There is no second business to lean on.
Net income was $31.4 billion in 2022 and $2.16 billion in 2023. A business that swings that far is one where a single year’s payout ratio tells you little and three years of them tell you more. Over the last three fiscal years diluted EPS went $0.37, $1.41, $1.36. Against a $1.72 dividend, none of those covers it.
What I am not measuring
Free cash flow is the number a dividend analyst normally checks first, and I do not have it in this dataset. That matters, because drugmakers carry large non-cash charges. Amortization of acquired products, for instance, can pull reported profit well below the cash a company generates, and Pfizer paid about $43 billion for Seagen in 2023 (according to Morningstar’s write-up, not our own data). A payout that is 226% of GAAP earnings could be closer to 100% of cash. It could also be worse if Pfizer is borrowing to cover it, and I have no balance sheet line here to check. Read the payout ratios in this piece as an upper bound on the problem, and pull the cash flow statement before you size a position on the yield.
The patent problem
Morningstar’s published analysis, which we carry on the quote page, lists the drugs that lose protection over the next few years: Ibrance and Xtandi in 2027, Eliquis in 2028. It also credits Pfizer with a $7.2 billion annual cost-savings plan due by the end of 2027. I treat those as outside facts and cannot verify the dates myself. What I can say is the direction. The company has to replace revenue on the way out while taking cost out at the same pace, and the dividend is being paid in the gap.
Morningstar assigns a narrow moat and expects revenue to decline for several years before growth resumes in 2030. Cutting costs can only carry a payout for so long. I read that as the real risk to the dividend. A sudden cut is unlikely. A payout that sits above earnings for several years is the setup in which boards freeze it and then reset it.
What the market is telling us
Twenty analysts cover the stock, and the analyst page has 35% at buy, 60% at hold and 5% at sell. The average target is $28.80, about 4% above the price, with a range from $25 to $35.75. The lowest target is 10% below the price and the highest 29% above. For a stock yielding more than 6%, that is a narrow band and a lukewarm one. These are people who expect the dividend to be paid and do not expect much else.
The stock itself has moved. It closed August at $28.46, up from $23.67 at the end of June, and now trades 5% below the 52-week high of $29.21 and 26% above the low of $22.03. I have no news attached to that rally that would explain it, so I will not guess. Reports have not moved the shares much either: the last four earnings days were +1.5%, +0.6%, -3.3% and -1.5%. Short interest was 2.7% of float on August 31. Nobody is betting on a cut with real money, at least not through shorting.
| Metric | Value | Context |
|---|---|---|
| Price (approx.) | $27.66 | 52-week range $22 to $29 |
| P/E (TTM) | 36.4x | Five-year average -14.0x |
| Price-to-sales | 2.5x | Five-year average 2.7x |
| Analyst ratings | 35% buy, 60% hold | 20 analysts; average target $29 |
| Dividend yield | 6.22% |
What a cut would actually look like
I do not expect one soon, but the arithmetic is worth having. The table below shows the payout ratio at three earnings levels against the current dividend and against two hypothetical reductions.
| Earnings basis (EPS) | Dividend $1.72 | 25% cut, $1.29 | 50% cut, $0.86 |
|---|---|---|---|
| Trailing 12 months ($0.76) | 226% | 170% | 113% |
| Fiscal 2025 ($1.36) | 126% | 95% | 63% |
| Forward estimate ($1.94) | 88% | 66% | 44% |
A 25% cut, to about $1.29, would put the payout below 100% on last year’s earnings and at 66% on the forward estimate. That is the version I would call sustainable. At current earnings power, though, even a 50% cut leaves the ratio above 100%, which is why the trailing-twelve-month number cannot be the base case. It is a low that the forward estimate must clear.
For readers weighing this against a dividend-growth approach, our piece on high yield versus dividend growth covers the tradeoff. And the company’s obesity ambitions run into the same competitors described in our Eli Lilly forecast, which is the honest answer to the question of where new growth might come from.
The two prints that settle it
The dividend is not really under threat from one number. It is under review by two. If the next report shows net income back above $2.45 billion, the quarterly dividend cost, I would call the coverage story intact. If it falls below that line again, with revenue still near $15 billion, the forward EPS of $1.94 needs a new explanation, and I would start pricing a freeze.
I could be wrong in the other direction, too. If cost cuts arrive early and the new oncology drugs sell, the forward estimate may prove conservative and the yield a bargain. Nothing in the reported numbers rules that out.
Until then I would treat the 6.22% yield as what it looks like: a fair price for a payout that the business can cover on a good quarter and not on a bad one. The two quarters to watch are the next two.
Financial disclaimer: The content on StockVane is for educational and informational purposes only and should not be construed as professional financial advice. Stock market investing involves risk of loss.
Sources: Dividends (SEC Investor.gov glossary) (https://www.investor.gov/introduction-investing/investing-basics/glossary/dividend) · Dividends tax topic (IRS) (https://www.irs.gov/taxtopics/tc404)