
Of every dollar Qualcomm booked in its latest quarter, about 85 cents came from selling chips. That is $8.5 billion out of $9.9 billion in the quarter, and it is the reason the headline about its biggest customer building its own modem deserves more attention than the licensing business that Qualcomm bulls like to point to. The royalty arm brought in $1.28 billion, 12.8% of the quarter. It is a good business. It is not the business at risk, and it is not the business paying for the stock.
I am not worried yet, but the reason is not that licensing cushions the blow. The reason is price. At $177.72, the shares are 31.0% below their 52-week high of $258, and the market is already paying for a company whose revenue is shrinking. What I have to decide is whether that discount is big enough.
Thesis: Qualcomm is priced for a slow decline in phone-chip revenue, that decline is visible in the numbers, and the stock only works if the decline stops around the current quarterly level of $9.9 billion. That is a judgment about the run-rate, and I will show the evidence and the case against it.
Where the chip revenue stands
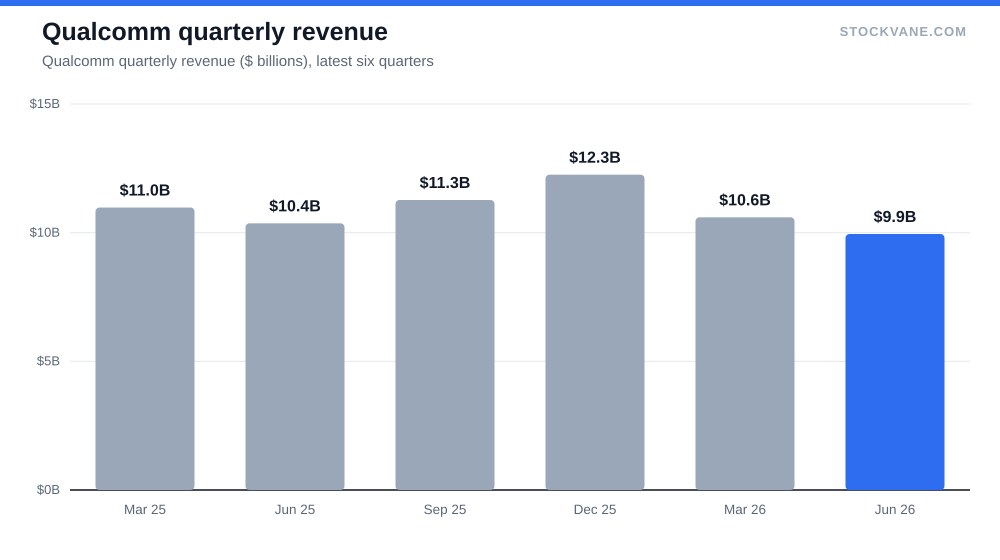
Quarterly revenue has moved from $11.27 billion to $12.25 billion, then to $10.60 billion, then to $9.9 billion. Year over year those quarters grew 10%, grew 5%, fell 3% and fell 4%. Two consecutive declines after a strong stretch, and the last one came with a sequential drop of -6% too.
Annualize the latest quarter and you get $39.8 billion, which is 10% below fiscal 2025 revenue of $44.3 billion. That is the number to hold against the story. Fiscal 2025 was up 14% from $39.0 billion, a record, just above fiscal 2022’s $44.2 billion. If the current pace holds, the company is sliding back to where it was in fiscal 2023, when revenue was $35.8 billion.
A second point on trends. Revenue has been cyclical here for years: down 19% in fiscal 2023, up 9% in 2024, up 14% in 2025. The handset market moves in two-to-three-year swings and Qualcomm moves with it, so a two-quarter decline is not by itself proof of anything. What it does is put the burden on the next two prints.
For context on how much of a semiconductor decline is cyclical versus structural, our piece on chip stocks worth owning beyond Nvidia covers the split across the group. Qualcomm’s exposure is heavier to a single end market than most names on that list.
What the Apple modem story does to the arithmetic
Apple has spent years developing its own cellular modems, and it has shipped them in some products already. I will keep this part general on purpose. I have no figure in our database for how many chips Apple buys or what share of Qualcomm’s sales it represents, and I will not quote one from memory. The exposure is publicly described as large, and I treat it that way.
What I can do is put a dollar frame around it. Chips are $8.5 billion a quarter, or roughly $34 billion annualized. Suppose a customer worth a fifth of chip revenue disappeared over three years. The arithmetic would be $6-7 billion of annual revenue gone, spread out at about $2 billion a year. That is an illustration, not a forecast. It shows why the story is a slow bleed rather than a cliff, and why the stock does not have to fall in a day to be a bad holding.
A slow bleed is harder to price than a cliff. A cliff gets a discount up front. A bleed gets a discount every quarter that the prior quarter’s number beats the next one, and the shares trade on the direction of revisions.
Trailing and forward earnings do not agree
The trailing P/E is 20.3, against a five-year average of 18.6, which is the 68th percentile of its range. The valuation tab shows that. On forward estimates the multiple is 32.3. A forward multiple 12 points above the trailing one means analysts expect earnings to fall. Forward EPS of $5.49 is 37% below the $8.75 of trailing earnings implied by the price.
There is another wrinkle. Reported diluted EPS for fiscal 2025 was $5.01, down 44% from $8.97, while the trailing figure implied by the P/E is $8.75, 75% higher. Both cannot describe the same business, and our data does not say which period contains the unusual item. My read is that fiscal 2025 carried a large one-time charge (net income was $5.5 billion against $10.1 billion the year before, while operating income rose to $12.4 billion), and that the trailing number is closer to normal. That is an inference. If it is wrong, the multiple is higher than 20 and the stock is more expensive than it looks.
So the shares are cheap on trailing earnings and expensive on forward ones. Whichever you believe, you are betting on what happens to phone-chip revenue, which brings me back to the run-rate.
| Metric | Value | Context |
|---|---|---|
| Price (approx.) | $177.72 | 52-week range $121 to $258 |
| P/E (TTM) | 20.3x | Five-year average 18.6x |
| Price-to-sales | 4.5x | Five-year average 4.2x |
| Analyst ratings | 33% buy, 62% hold | 24 analysts; average target $203 |
| Dividend yield | 2.02% |
Margins say the decline is not free
Revenue is only half of it. On the financials tab, gross margin was 55.4% in fiscal 2025, against 56.2% the year before, so the company gave up about a point of margin while it grew 14%. Operating margin was 28% on operating income of $12.4 billion, a good number on its own, but earlier peaks were higher: operating income was $15.9 billion in fiscal 2022 on similar sales.
That comparison is the uncomfortable one. Fiscal 2022 and fiscal 2025 had nearly identical revenue, $44.2 billion and $44.3 billion, yet operating income was $3.5 billion lower in the later year. The chip mix and the cost of a broader product push are the obvious suspects, but I cannot separate them with our data. If revenue now falls another 10%, operating income will not fall by 10%. It will fall faster, because fixed costs stay put. Watch that ratio in the next report.
What the market and the analysts are saying
The 24 analysts covering the stock are split in an unusual way: 33% rate it a Buy, 62% a Hold and 4% a Sell. The average target is $203, 14% above the price, but the range runs from $159 to $400. The bottom of that range is 11% below the current price, while the top is 125% above. A 400-dollar target on a $178 stock is an outlier, and it drags the average up. I would use the median instinct, not the mean: somewhere in the low 200s at best.
For a contrast in how the market treats a chip name that keeps beating, see AMD’s run. The stock’s reaction to reports tells you how uncertain everyone is. Qualcomm rose 15.1% after the April report, then fell 2.6% in July, 8.5% in February and 3.6% the November before. The average absolute move is 7.5%. That is a stock that swings on each print, and it swung the wrong way in three of the last four.
Short interest is 3.2% of the float, which is low. Nobody is betting on a collapse. The quant grade sits at C, the same as before. Nothing in the flows says the market has found a new view.
The case I could be wrong about
Two things would make the cautious reading wrong. The first is that the chip decline is cyclical, not structural. A handset recovery, or a strong new product cycle at its other customers, could put quarterly revenue back above $11 billion, in which case the trailing multiple of 20.3 is cheap and the shares deserve a re-rating. The second is that the company’s diversification away from phones works faster than I expect. The nonreportable segments, which is where new bets sit, were only $165 million in the latest quarter, 1.7% of the total. I see no evidence they can carry the weight yet.
The third possibility runs the other way and is uncomfortable. The forward P/E of 32.3 may be the honest one, and the trailing P/E of 20.3 is flattered by a base that will not repeat. In that case the stock is not cheap at all. It is a shrinking business at 32 times next year’s earnings, and the 5.8% drop on the day our data was pulled is the market recalculating.
I do not know which of these is right. What I know is that the price already reflects a fair amount of bad news. It sits 47% above its 52-week low of $121, so it has not been left for dead. Neither is it priced as a franchise that will grow.
The dividend of $3.59 a share, a 2.02% yield, pays a holder to wait. It is not enough to justify holding through another two quarters of falling sales, but it softens the wait.
The revenue floor I would use
The line I would draw is $9.5 billion a quarter. The last print was $9.9 billion. If the next two quarters come in at or above $9.5 billion, and the year-over-year decline narrows from 4% to 2% or better, I read the decline as cyclical and the stock as fair at the current multiple. If revenue slips under $9.5 billion, the trailing P/E stops mattering, because the earnings base is shrinking underneath it, and I would not add to a position at any price near $178.
Until one of those two things happens, I would not add here, and I would keep watching. That is not a call that the stock will fall. It is a statement that the evidence has to improve before I take the risk.
Financial disclaimer: The content on StockVane is for educational and informational purposes only and should not be construed as professional financial advice. Stock market investing involves risk of loss.
Sources: Dividends (SEC Investor.gov glossary) (https://www.investor.gov/introduction-investing/investing-basics/glossary/dividend) · Dividends tax topic (IRS) (https://www.irs.gov/taxtopics/tc404)