
Texas Instruments earned $6.14 billion of operating income in fiscal 2025. In fiscal 2022 it earned $10.40 billion. Revenue over the same stretch fell only from $20.0 billion to $17.7 billion, so the company sells 88% of what it sold at the peak and keeps 59% of the profit. The stock, at $267, is priced as if that second number is about to catch up with the first.
The trailing P/E is 40.5, against a five-year average of 28.1. That is 1.44 times the stock’s own history, in a business that most of the semiconductor sector treats as the cyclical, low-drama corner. My read: the market has already paid for a margin recovery that the reported numbers have only started to hint at, and the price leaves little room for the recovery to arrive slowly.
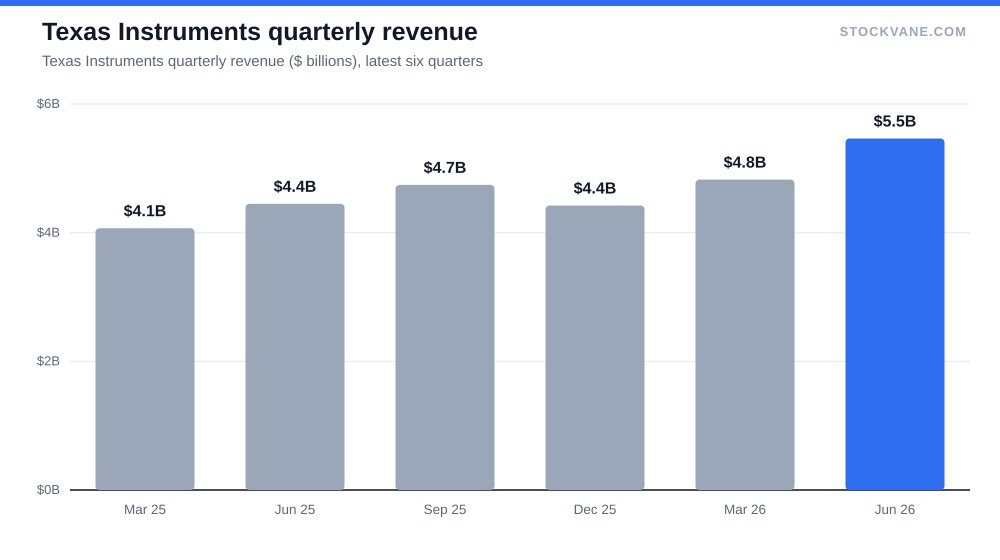
Revenue is back, margin is not
The revenue story is the easy half. Sales fell from $20.0 billion in 2022 to $17.5 billion in 2023 and $15.6 billion in 2024, then rebounded 13% to $17.7 billion in 2025. The latest quarter, per the financials tab, came in at $5.5 billion, up 23% from a year earlier and 13% above the prior quarter. Annualize that quarter and you get $21.9 billion, which is already above the fiscal 2022 peak of $20.0 billion.
So revenue has recovered. Profitability has not.
Gross margin was 68.8% in fiscal 2022. It was 58.1% in 2024 and 57.0% in 2025, still drifting lower after sales turned up. The EBIT margin in the database tells the same story with more force: 51.2% in 2022, 44.4% in 2023, 38.1% in 2024, and 35.4% in 2025. That is 15.8 points gone in three years. (My own operating-income-over-revenue calculation gives roughly 34.7%; the two measures differ slightly because of how the database treats certain items, and I use the database figure for the trend.)
Why would margin keep falling after revenue stabilized? Two reasons, and I would hold both loosely. The first is depreciation. Texas Instruments has spent heavily on new 300-millimeter fabs, and the depreciation from those plants lands on the income statement before the plants are full. The second is mix and utilization: a fab running at 70% costs nearly as much to operate as one running at 90%, so the last dollars of revenue are the most profitable ones. Both are inferences from the shape of the numbers, not statements from the company, and neither is in the data I pulled. What the numbers do show is that a 23% year-over-year jump in quarterly revenue has not yet turned the annual margin line upward.
What the run-rate is worth at two margins
Here is the arithmetic that matters. Take the current annualized revenue of $21.9 billion. At the fiscal 2022 EBIT margin of 51.2%, that revenue throws off about $11.2 billion of operating profit. At the fiscal 2025 margin of 35.4%, it throws off about $7.7 billion. The gap is roughly $3.5 billion a year, more than half of what the company earned in operating income in all of fiscal 2025.
That gap is the whole debate. A buyer at today’s price is implicitly paying for some slice of it.
Consensus expects a lot of it. Forward EPS in the database is $9.55, against trailing EPS of $6.58, an implied 45% increase. Trailing EPS itself is already 21% above the $5.45 diluted figure for fiscal 2025, because the trailing window now includes two strong quarters. On forward earnings the P/E drops to 27.9, only a little below the five-year average of 28.1 on trailing numbers, which is the version of the bull case I take seriously. It says: if earnings do climb toward $9.55, the multiple is ordinary.
The counter-case is that forward numbers are where analysts put the recovery they hope for. Texas Instruments earned $8.26 per diluted share in fiscal 2021 and $9.41 in fiscal 2022. The forward figure asks for a return to the neighborhood of that peak within a year or so, at a company whose gross margin is more than 11 points below where it was then.
Where the multiple sits against its own history
The valuation tab puts the current trailing P/E at the 90th percentile of its five-year range, whose band runs from 18.8 to 37.4. Price-to-sales is 12.4 against a five-year average of 9.7 (93rd percentile), and price-to-book is 13.4 against 11.1. The stock is expensive on every gauge the database tracks, and all three sit in the top decile or close to it.
Some context helps. The industry average P/E in the database is 30.6, so Texas Instruments carries a premium of roughly a third over its peers. For a sense of what a high multiple demands elsewhere, compare Costco at 50 times earnings, where the argument is durable membership income, and ASML, where the argument is a monopoly on the most advanced lithography. Texas Instruments has neither of those. What it has is scale in analog, a huge product catalog, and a manufacturing cost advantage that shows up when its fabs are full.
That last point deserves attention. The premium multiple is a bet on fixed-cost absorption, and that cuts both ways. If revenue keeps rising at 20% a year, margins should follow. If revenue stalls at the current run-rate, the depreciation stays and the multiple has nothing to stand on.
The recent reports
Reaction to earnings has been anything but calm for a supposedly boring stock. The average absolute move after the last four reports is 9.5%. April’s report produced a 19.4% jump, January’s a 9.9% gain, and October 2025 a 5.6% drop. Most recently, on July 22, the shares fell 3.1%, on the same quarter that delivered 23% year-over-year revenue growth.
I read that last reaction as the market saying growth is now assumed. A beat on revenue no longer moves the stock; a beat on margin might. The database contains no company commentary explaining the July move, so I will not assign a cause to it.
Segments help. In the most recent quarter, Analog accounted for $4.37 billion, 79.9% of revenue, and Embedded Processing for $788 million, about 14.4%. The remaining 5.7% is other. That is a concentrated business: four of every five revenue dollars come from analog chips, the part of the portfolio that carries the higher margin, so the mix argument for margin expansion is smaller than it would be at a company with a large low-margin segment to shrink.
| Metric | Value | Context |
|---|---|---|
| Price (approx.) | $266.64 | 52-week range $150 to $332 |
| P/E (TTM) | 40.5x | Five-year average 28.1x |
| Price-to-sales | 12.4x | Five-year average 9.7x |
| Analyst ratings | 62% buy, 29% hold | 21 analysts; average target $336 |
| Dividend yield | 2.11% |
What the Street sees
Twenty-one analysts cover the stock. 62% rate it a buy, 29% a hold, and 10% a sell. The average target is $336, 26% above the current price, with a range from $225 to $405. The low target is 16% below the market and the high target is 52% above it. A spread that wide, from $225 to $405, tells me the analysts disagree about margin, not about revenue.
Short interest is only 2.3% of float, so no one is leaning hard against the story. The quant rating in the database rose from D to B over recent weeks, which measures momentum and revisions more than value, and I would not read it as a call on the price.
The stock trades 19.8% below its 52-week high of $332 and 78% above the low of $150. It has already made most of a round trip.
The dividend is the other half of the case
Texas Instruments pays $5.62 per share over the trailing twelve months, a 2.11% yield. Against trailing EPS of $6.58, that is an 85% payout ratio. Against fiscal 2025 diluted EPS of $5.45, the dividend exceeded earnings outright. The payout is not in danger at these numbers, since the trailing figure has been climbing, but it does mean the yield is a return of the recovery, not a substitute for it.
For an income-oriented investor, and I sell cash-secured puts more often than I buy shares outright, this matters for sizing. A 2.11% yield does not compensate for a 20% drawdown, and this stock has spent the past year 20% below its high. Selling puts on it makes sense only at a price where being assigned would feel like a fair purchase, not a rescue.
I am not covering the tariff and export-control questions here, or the company’s capital spending plans in detail. The database has no figures on them and I do not want to fill the space with guesses. The Fed’s September hike matters for industrial and auto demand, but the effect will show up in orders, not in this quarter’s multiple.
The strike and the margin I would wait for
The main risk to my caution is simple: revenue keeps compounding near 20% and the fabs fill faster than I expect, which would pull margin up and make today’s multiple look cheap in hindsight.
The number to watch is the EBIT margin in the next annual figures. If it moves back above 40%, up from 35.4%, the operating-profit gap I described narrows and the multiple begins to make sense. If revenue holds near $21.9 billion while margin stays under 37%, forward EPS of $9.55 looks too high, and the 90th-percentile P/E has nothing under it.
I would not chase the shares at $267. A put struck near $225, the lowest analyst target and about 16% below the market, is a price at which I would be comfortable owning this business and collecting the 2.1% yield while the fabs fill. If the margin turns first, I will have missed some upside. I can live with that.
Gavin Thorne has invested in U.S. stocks for six years and previously worked at a large publicly traded internet company. He writes about income-oriented strategies, including cash-secured puts, and about how he reads company data. This article reflects his personal research process and is for informational purposes only. It does not constitute investment advice.
Sources: Dividends (SEC Investor.gov glossary) (https://www.investor.gov/introduction-investing/investing-basics/glossary/dividend) · Dividends tax topic (IRS) (https://www.irs.gov/taxtopics/tc404)