
Amazon spent 92 cents of every dollar of operating cash flow on property and equipment last year. Oracle spent $1.74. Those two figures tell you more about who can afford the AI buildout than any capex headline, and they are why I think buying tech in the fourth quarter has to start with the cash flow statement, not the growth rate.
My view is that a cautious buyer should own the companies whose cash flow covers the spending with room to spare, keep each position small enough to survive a bad report, and stay away from the ones funding the buildout with borrowed money. Only a few names clear that bar, and they are not the ones with the loudest stories.
Who is paying for the buildout
Microsoft, Alphabet, Amazon and Meta put about $405 billion into property and equipment in their latest fiscal years. Every one of them spent far more than the year before. What matters is how much of the money they generated that the spending consumed.
| Company (latest fiscal year) | Capital spending | Operating cash flow | Spending as % of operating cash flow | Free cash flow |
|---|---|---|---|---|
| Alphabet (2025) | $91B | $165B | 56% | $73.3B |
| Meta (2025) | $70B | $116B | 60% | $46.1B |
| Microsoft (FY2026) | $116B | $183B | 63% | $67.0B |
| Amazon (2025) | $128B | $140B | 92% | $7.7B |
| Oracle (FY2026) | $56B | $32B | 174% | $-23.7B |
Microsoft’s fiscal year ended in June, so it is the most recent. Its capital spending was $116 billion against $183 billion of operating cash flow, about 63%, and that spending was 80% higher than a year earlier. Alphabet spent 56% of its operating cash flow, Meta 60%, and Amazon 92%. Amazon’s free cash flow fell from $32.9 billion to $7.7 billion in one year, on revenue that grew 12%.
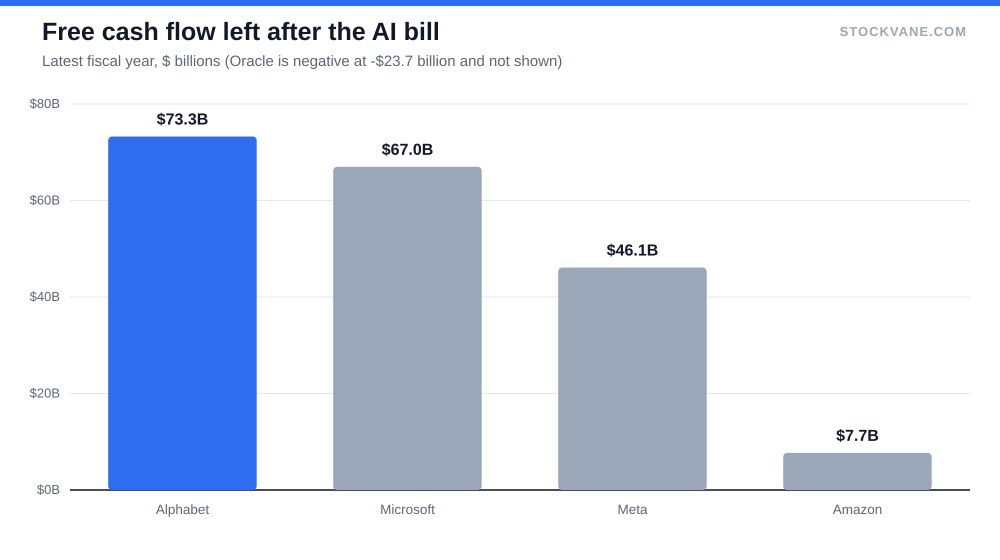
The pattern is the opposite of what the growth numbers suggest. Meta grew revenue 22% and Microsoft 18%, yet the free cash flow each produced is lower than in an earlier year, at $46.1 billion for Meta and $67.0 billion for Microsoft. Alphabet is the exception: it grew free cash flow slightly, to $73.3 billion, while raising spending 74%. I read that as the best evidence in the group that the spending is being paid for by the business.
What running out of cash looks like
Oracle is the case study. In fiscal 2026 it spent $55.7 billion on capital expenditure against $32.0 billion of operating cash flow, so free cash flow was negative $23.7 billion. Spending had risen 162% in a year. The shares are about 55% below their 52-week high, and the StockVane quant model grades the stock an E. Our piece on Oracle’s backlog covers why a full order book and a strained cash flow can exist together.
I do not want to overstate this. A company that borrows to build capacity for customers who have signed contracts is doing something different from one that borrows on a hope. Oracle may turn out to be right. But an investor who cannot see the payback in the cash flow statement is taking the company’s word for it, and I do not think a cautious buyer should do that this quarter.
Where I would start
Alphabet has the best mix: free cash flow that held up even as spending rose 74%, with that spending taking only about 56% of operating cash flow, and revenue growing 15%. The trailing P/E of 17.5 on the valuation tab looks cheap, but the forward P/E is 25.6, so trailing earnings include something the next year’s will not. I do not know exactly which items, so I would use the forward figure. Our earlier look at why Alphabet is the cheapest big tech stock makes the longer case.
Meta is cheaper on forward earnings, at 21.0 times, and it is growing faster. It is also the stock whose earnings reactions have been hardest to live with. Over its last four reports it moved an average of 9.6% in one direction or the other on the day. That is the price of admission, and it argues for a smaller position than the valuation alone would suggest.
The good business at the full price
Microsoft is the hardest one to argue against on quality. Revenue reached $332 billion in fiscal 2026, up 18%, and operating cash flow was $183 billion. The shares trade at 27.5 times trailing earnings and about 10% below their high. The StockVane quant model grades it a D, which reflects price action and not the business, and the stock rose 15.5% on its most recent report after three declines.
My reservation is the direction of free cash flow, which has slipped from $74.1 billion two years ago to $67.0 billion. I would not call that a warning. It is what happens when spending grows 80% in a year. But it means the stock needs revenue growth to keep pace with a much larger capital base, and our Microsoft forecast walks through what that requires.
Amazon: still spending, still possibly right
Amazon is the hardest name to place. It generated $140 billion of operating cash flow, more than any company in the table except Microsoft and Alphabet, and it spent nearly all of it. The stock trades at 20.4 times trailing earnings, revenue is growing 12%, and the shares jumped 15.3% on the most recent report. The StockVane quant model grades it a C, middling rather than alarming. I would treat Amazon as a watch-list name until free cash flow moves back toward the $30 billion it earned in 2023 and 2024. Nothing is broken. There is just no margin for a slower year.
Apple sits outside the trade
Apple does not depend on the AI capital cycle in the same way, and its cash flow shows it: $99 billion of free cash flow on $416 billion of revenue. The problem is the price. The stock trades at 38.5 times trailing earnings and is only 2% below its high, while revenue grew 6%. That is a growth multiple on a business growing at a mature rate, and it leaves little room for a disappointment. A cautious buyer has better places to put the same dollar.
Outside the platform companies
Cash-rich companies that sell into the buildout without funding it look sturdier. Cisco earned $12.8 billion of free cash flow on $63 billion of revenue, grew 12%, and carries a quant grade of B. Analog Devices and Texas Instruments are recovering cyclical businesses, and the gap between their trailing and forward P/E ratios shows the earnings recovery the market expects. That gap is a bet, so it needs sizing as one. Texas Instruments is in a heavy spending phase of its own, with capital spending of $4.5 billion leaving free cash flow of $2.6 billion. Our piece on semiconductor stocks beyond Nvidia covers this group.
| Company | Trailing P/E | Forward P/E | Revenue growth (latest year) | Quant grade | From 52-week high |
|---|---|---|---|---|---|
| Microsoft | 27.5x | 25.1x | 18% | D | -10% |
| Alphabet | 17.5x | 25.6x | 15% | C | -14% |
| Meta | 25.1x | 21.0x | 22% | D | -15% |
| Cisco | 32.9x | 27.6x | 12% | B | -16% |
| Analog Devices | 44.6x | 27.9x | 17% | B | -15% |
| Texas Instruments | 40.5x | 27.9x | 13% | B | -20% |
| Apple | 38.5x | 36.1x | 6% | B | -2% |
What this screen leaves out
I have not covered Nvidia or the other chip makers that sit on the receiving end of this spending, because their case depends on order books rather than on how a customer pays. That is a separate argument. I have also left out the private AI labs, which do not report cash flow at all.
The strongest argument against my approach is that cash flow statements look backward. Alphabet’s spending rose 74% in its latest year, and if the payback is slow, the 56% share of operating cash flow it now consumes could climb quickly while the free cash flow I lean on shrinks. That is the condition that would make me wrong about the ranking. A screen built on last year’s filings has no way to warn you before it happens, which is one reason I keep sizes small.
How I would size it
The earnings moves in the chart below are the practical constraint. A stock that moves 8% either way on a report can cost a new position real money in a single session.
One way to handle that is to be paid for the risk before taking it. Selling a cash-secured put on a name you would be glad to own, at a strike well below the current price, pays you to wait for a pullback, and the obligation is the same cash you would have spent buying the shares. Our guide to selling puts explains the mechanics and the ways it can go wrong, including being assigned shares in a falling market. Here is the arithmetic for Alphabet at about $350. A strike 10% lower is $315, which ties up $31,459 in cash per contract. If the shares were assigned at that level, the forward P/E on the 25.6-times basis would be about 23, before counting any premium received. That is the point of the exercise: you pick the price at which you would want the stock and let the market pay you while you wait. It is a method, not a prediction, and it suits money you would not need for a year.
Where I would stop buying
I would add to Alphabet, Meta and Microsoft on weakness, in small steps, and leave Amazon and Oracle alone until their free cash flow turns. The specific thing that would make me stop is a hyperscaler whose free cash flow goes negative while spending keeps rising, because at that point the buildout is being financed by lenders, and lenders can change their minds. None of the four large platform companies is there yet. Oracle already is.
Gavin Thorne has invested in U.S. stocks for six years and previously worked at a large publicly traded internet company. He writes about income-oriented strategies, including cash-secured puts, and about how he reads company data. This article reflects his personal research process and is for informational purposes only. It does not constitute investment advice.
Sources: Price-to-earnings ratio (SEC Investor.gov glossary) (https://www.investor.gov/introduction-investing/investing-basics/glossary/price-earnings-pe-ratio) · How to read a company's 10-K (SEC Investor.gov) (https://www.investor.gov/introduction-investing/investing-basics/glossary/10-k)
Pingback: The Semiconductor Stocks Worth Owning Beyond Nvidia – StockVane