
NextEra is up 18.7% over the past 260 sessions, the best return among the regulated utilities we track, and it still sits 16.6% below its own closing high for that stretch. Nobody else in the group is that far under its peak except Constellation. A stock that leads its peers and trails its own high is telling you something, and it is worth working out what.
The title of this post promises two things: that NextEra is the cleanest way to own the electricity demand boom, and that there is one catch. Here is my read. The demand story is plausible and the franchise is strong. The catch is in the income statement: profit per share has gone backwards for two years while the story got louder, and the market has already knocked the multiple down to 18.1 from a five-year average of 34.2.
Two businesses, one of them exposed to the boom
NextEra is really two companies (the NextEra quote page carries the segment detail). Florida Power & Light is a regulated utility that earns an allowed return on the wires, plants and poles it builds. In the June quarter it produced $4.90 billion of revenue, or 65.0% of the total. NextEra Energy Resources, the renewable developer and battery builder, brought in $2.53 billion, 33.6%. Corporate and other was the remaining 1.4%.
That split matters for the word “cleanest.” The regulated half grows when Florida grows, and that growth is steady. The developer half is the one a data-center customer calls when it wants a large block of carbon-free power. So only about a third of the revenue is directly wired to the demand thesis, and the rest is a rate-base business that behaves like a bond with a growing coupon.
I cannot measure the national demand boom from our database. Load growth, data-center interconnection queues and the forecasts behind them come from utility and grid-operator filings, and I would rather flag that than quote a number I cannot trace. What the database does show is how NextEra has monetized growth so far, and the answer is not flattering.
The catch is on the income statement
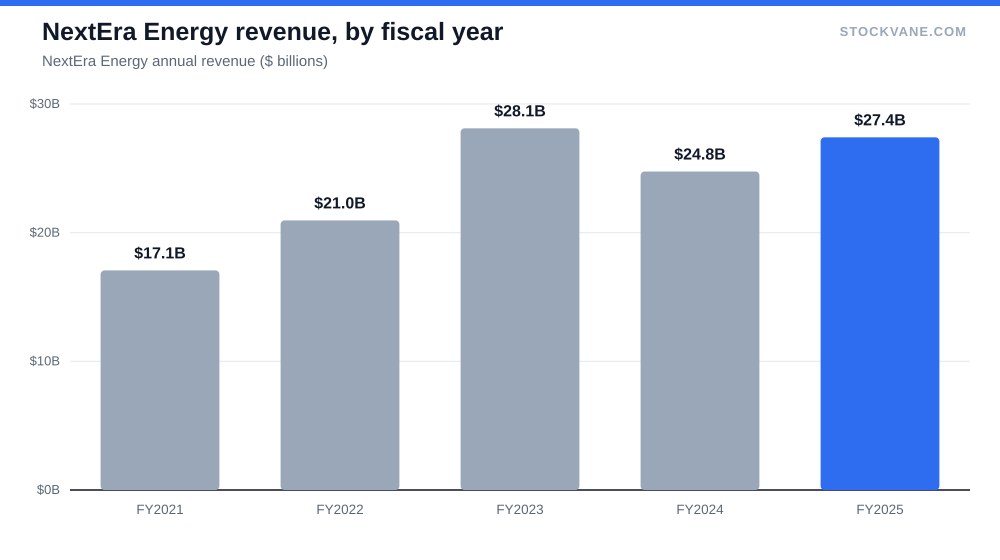
The financials tab has the full series. Revenue moved around: FY2022 was $21.0 billion, FY2023 $28.1 billion, FY2024 $24.8 billion, FY2025 $27.4 billion. Revenue in the year to date has recovered, with the June quarter at $7.5 billion, up 12% from a year earlier.
Profit tells a harder story. Net income was $6.28 billion in FY2023, $5.70 billion in FY2024 and $5.33 billion in FY2025, a fall of 15% across two years. Diluted EPS went from $3.60 to $3.37 to $3.30, down 8%. That is the catch.
The industry story says demand is turning up. The reported earnings say NextEra’s per-share profit is lower than it was two years ago.
Operating margin was 29% in FY2025. The DB’s separate EBIT margin reads 33.2%; I use the operating-profit figure in this post.
One wrinkle deserves a sentence. The P/E of 18.1 in the valuation snapshot is built on a trailing EPS of $4.45, while the annual diluted EPS in the financial statements was $3.30 for FY2025. I do not know which adjustments explain the gap, so I use the snapshot for the multiple and the annual series for the trend.
Forward numbers do not fix the problem. The forward EPS estimate is $4.28, below that trailing $4.45, so the consensus forecast implies a 4% step down before any growth. Forward P/E is 18.8. For a stock sold on growth, that is a curious place to be.
Cheap against its history, fair against its group
Cheaper than it has been in years.
At $80, market value is $167.9 billion. The trailing P/E is 18.1, 0.53 times the five-year average of 34.2, sitting at the 15th percentile of its own five-year range. Against the industry average of 16.4, it is a small premium, about 10% above.
The price-to-sales ratio of 5.9 sits below its five-year average of 6.8, at the 32nd percentile. Price to book is 3.0 against a 3.5 average.
So the stock is cheap against itself and roughly fair against peers. That is the honest version of the valuation case. The 34x average was a period when investors paid a growth multiple for the renewable pipeline. Getting that multiple back needs EPS growth to show up in the reported numbers, and it needs the market to believe the growth will last through a rising-rate stretch, which is a demanding condition for a company that also has to finance a very large capital program while dividends keep being paid out of the same cash flows, so investors will want to see several quarters of clean results before they pay 34 times again.
| Metric | Value | Context |
|---|---|---|
| Price (approx.) | $80.47 | 52-week range $69 to $97 |
| P/E (TTM) | 18.1x | Five-year average 34.2x |
| Price-to-sales | 5.9x | Five-year average 6.8x |
| Analyst ratings | 64% buy, 36% hold | 11 analysts; average target $102 |
| Dividend yield | 2.96% |
The peer check on “cleanest”
If NextEra were the market’s clear favorite for the demand theme, its price would show it. The table below compares six power names on the same window. NextEra leads the regulated group at +18.7%, ahead of AEP at +15.0% and Dominion at +14.4%. Duke Energy gained 1.2% and Southern lost 2.7%. Constellation, the pure independent-power name, fell 14.3% and is 36.6% off its high.
| Utility (US listing) | Close, Sep 18 | Change over ~260 sessions | Below 260-session high |
|---|---|---|---|
| NextEra (NEE) | $80.47 | +18.7% | 16.6% |
| American Electric Power (AEP) | $120.00 | +15.0% | 12.8% |
| Dominion (D) | $63.58 | +14.4% | 10.4% |
| Duke Energy (DUK) | $117.53 | +1.2% | 10.4% |
| Southern (SO) | $85.52 | -2.7% | 12.3% |
| Constellation Energy (CEG) | $254.71 | -14.3% | 36.6% |
Two readings fit.
The generous one is that investors have bid up NextEra, and it has merely paused. The skeptical one is that the shares are now the most extended of the regulated group and the drawdown has just started. The 16.6% gap to the high, deeper than every regulated peer, points slightly toward the second.
I would also say what this comparison does not prove. It says nothing about earnings quality. Price change over a year mixes in rate moves, and utilities trade partly as bond substitutes. On September 16 the Fed raised its policy rate, and its dot plot points to more, which is the exact backdrop that hurts long-duration, dividend-paying stocks. My earlier look at what the September hike means covers the mechanics.
What the street and the tape say
Eleven analysts cover the stock. Seven of them rate it a buy, and the other four say hold, which is 64% buy and 36% hold with no sells. The average target is $102, 26% above the price, with the low at $90 and the high at $114. The lowest target is still 12% above today’s price.
That spread is much narrower than the disagreement you see on a growth name. Compare it with ASML, where six analysts all say buy and the stock still fell 22% in one month. Here the analysts are more divided.
The stock’s last two earnings reactions were +6.9% on April 23 and roughly flat on July 24. The average earnings-day move is 2.9%. Short interest is 2.4% of the float, about 4.6 days of volume, which is not a crowded short. Our quant grade dropped from B to D in September.
The dividend is 2.96%, or $2.38 a share over the last twelve months. For someone who wants income and exposure to load growth together, that yield is a real part of the case, and you can check the payout history on the NextEra dividends page.
What would prove me wrong
The main risk to my view is that I am too early in calling the earnings line the problem. Utility earnings follow the rate base with a lag: capital spent this year enters allowed returns only after regulators approve it, and the developer segment books gains on project sales unevenly. A single strong year can erase two weak ones. If that happens the stock is cheap today, and waiting for the proof will cost a rally.
Two conditions would change my mind. The first is earnings per share that grow again. Annual diluted EPS of $3.30 in FY2025 is 8% below FY2023. If FY2026 diluted EPS prints above $3.60, the FY2023 level, the catch is closed and the multiple has room to rise from 18.1.
The second is the rate path. If the Fed’s hiking cycle stretches and long yields keep climbing, a utility with heavy financing needs will pay more for every project, and the pipeline will earn less. A stock at 18 times earnings is not immune to that.
I am not covering the regulatory side in Florida, including rate cases and storm costs, because the database has no measure of them. They belong in any full due-diligence file. The Oracle comparison is instructive here: Oracle’s backlog is contracted revenue that the stock still doubts, while NextEra’s demand is a forecast that the stock has half-believed.
The EPS line that would close the catch
One number.
The number I would hold NextEra to is $3.60. That is FY2023’s diluted EPS, and clearing it means growth has finally reached the earnings line. Until it does, I would treat NextEra as a decent income holding with an option on the demand boom, sized for what it has earned rather than what it promises.
Gavin Thorne has invested in U.S. stocks for six years and previously worked at a large publicly traded internet company. He writes about income-oriented strategies, including cash-secured puts, and about how he reads company data. This article reflects his personal research process and is for informational purposes only. It does not constitute investment advice.
Sources: Dividends (SEC Investor.gov glossary) (https://www.investor.gov/introduction-investing/investing-basics/glossary/dividend) · Dividends tax topic (IRS) (https://www.irs.gov/taxtopics/tc404)