
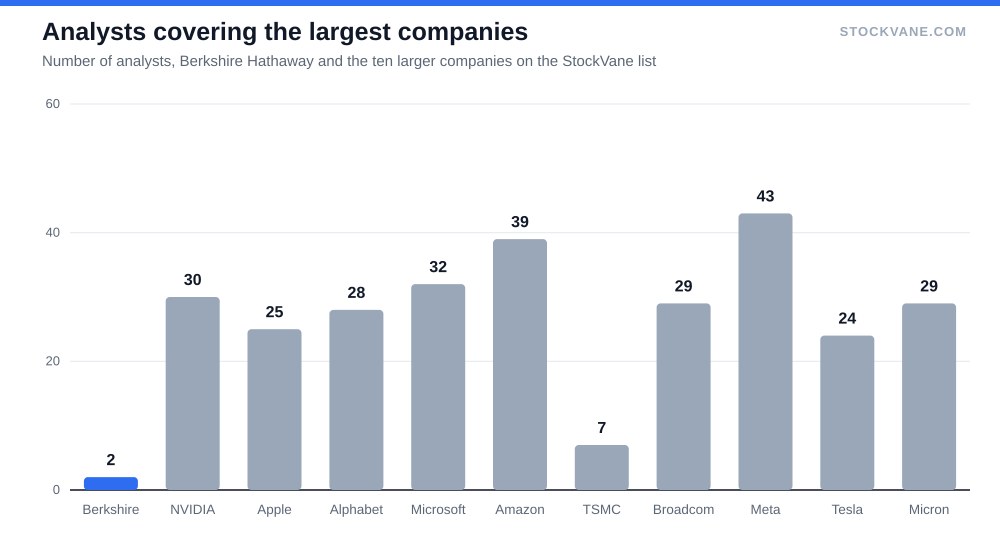
Every company ranked above Berkshire Hathaway by market value on our coverage list has at least seven analysts writing about it. Nine of the ten have 24 or more, and Meta has 43. Berkshire has 2. Its Class B shares closed at $509.77 on September 18, which values the company at about $1,091 billion, and the database shows no dividend payment. Two analysts, no dividend, a trillion dollars.
My claim is that this is less a mystery than a description. A company whose reported profit is mostly a function of stock-market marks gives an analyst little to forecast, gives a dividend investor nothing to collect, and gives a valuation model a number that changes by 6x from one quarter to the next. What is left is a fairly priced insurer and conglomerate, and the case for buying it today has to rest on something other than a bargain.
Two analysts, and what they say
That is the whole panel: one analyst says buy, the other says hold, and nobody says sell.
The company appears twice in our list, as the A and B shares at market-value ranks 12 and 13, and each listing carries the same two analysts. Of the 292 stocks with analyst data, 21 have two or fewer. Berkshire is by far the largest of them. The next one, Mitsubishi UFJ, is worth about $269 billion, roughly a quarter of Berkshire’s size.
With two opinions, the consensus is one buy and one hold. The targets run from $540 to $604, with an average of $572, which is 12% above the price. A range that narrow, on a sample that small, tells you where two people happen to agree and little else. I would not treat it as a signal in either direction. With so little published research to lean on, I put more weight on the price and flow data, the approach in our guide to money moving into and out of the US stock market.
Morningstar’s fair-value estimate in our data is $510, and the shares closed at $509.77. That is a discount of 0.05%, which rounds to none. The stock is also 5% below its 52-week high of $537.74 and 10% above the low of $464.01, and it is up 3.9% from $490.50 a year ago. Nothing here suggests the market is missing the company.
What the profit line is made of
The pattern in the quarterly numbers is the most useful thing on the page. Premiums earned, the insurance engine, barely move: they ran between $21.80 billion and $22.77 billion across the last eight quarters. Net profit ran between $4.67 billion and $30.86 billion over the same eight.
Something other than the operating businesses is producing that swing. The database’s net investment income line, which ranges from a loss of $6.78 billion to a gain of $20.55 billion, moves in step with net profit. I read that line as including mark-to-market changes on the equity portfolio, though the database does not say so directly. Berkshire’s equity investments were $324 billion at the end of the June quarter, so a single-digit move in the market is worth tens of billions of dollars.
| Quarter ended | Net profit ($B) | Premiums earned ($B) | Net investment income ($B) | Diluted EPS, Class B ($) |
|---|---|---|---|---|
| Jun 2026 | 25.77 | 22.48 | 15.64 | 11.91 |
| Mar 2026 | 10.18 | 22.00 | -3.29 | 4.68 |
| Dec 2025 | 19.27 | 22.46 | 16.42 | 8.90 |
| Sep 2025 | 30.86 | 22.45 | 20.55 | 14.28 |
| Jun 2025 | 12.46 | 22.20 | 7.59 | 5.73 |
| Mar 2025 | 4.67 | 21.80 | -6.78 | 2.13 |
| Dec 2024 | 19.75 | 22.77 | 4.24 | 9.13 |
| Sep 2024 | 26.48 | 22.05 | 18.64 | 12.18 |
The annual figures make the same point at a larger scale. Net profit was $-22.0 billion in fiscal 2022, then $97.1 billion in 2023, $89.6 billion in 2024 and $67.3 billion in 2025. A business that earns a stable premium stream and owns many operating companies does not lose $22 billion in a year because of underwriting. The swing came from the investment marks, in a year when equity markets fell.
Per Class B share, quarterly diluted earnings ranged from $2.13 to $14.28. That is the reason the trailing P/E on the quote page is not a useful anchor. The multiple of 12.8 divides the price by the sum of the last four quarters, $39.77 a share, while the snapshot’s own EPS field still shows $31.04, which is the fiscal 2025 figure. Two different earnings numbers sit on one page, and the gap between them, about nine dollars a share, is what a strong quarter does to a trailing sum.
The forward multiple points the other way
Berkshire’s forward P/E in our data is 23.2. Dividing the price by that multiple implies about $22 of expected earnings per share, roughly 45% below the trailing $39.77. I would not read that as a forecast of falling profit. The more natural reading is that the two analysts are projecting earnings before investment gains and losses, which is the part of profit you can model at all.
So the same stock trades at 12.8 times one number and 23.2 times another. Which one is right depends on whether you believe the equity portfolio will keep adding to earnings, and no analyst can promise that in the way that they can forecast premiums.
Our piece on JPMorgan at a record high asked what an investor is betting on at 15 times earnings, a single multiple that means roughly the same thing to everyone who reads it. Berkshire offers two, 12.8 and 23.2, and they disagree by almost a factor of two.
The business underneath
In the June quarter, Insurance produced 25.7% of revenue, Manufacturing 22.2%, Pilot 14.7% and McLane 11.9%. Pilot and McLane together are 26.6% of sales. Revenue is not profit, and those two are fuel and food distributors whose sales figures run large relative to what they keep. The revenue split therefore understates how much of the earnings power sits in insurance and manufacturing.
Total assets were $1,263 billion against liabilities of $513 billion, which leaves about $750 billion of net assets, or roughly two-thirds of the market value. Long-term debt is $126 billion. Investments of $716 billion are about 57% of total assets.
One line matters here.
Cash is where I would look. It stood at $40.6 billion at the end of June, down from $58.1 billion in March. I cannot tell from the database whether that reflects purchases, debt repayment or a timing effect, and I will not guess. What I can say is that a company that pays no dividend has to answer the question of where its cash goes, and only the cash line will answer it.
No dividend is a choice with a cost
56 of the 300 stocks in our coverage pay no dividend, so Berkshire is not alone. It is alone at this size. An owner of this stock earns only through the price. That is a legitimate way to compound capital, and our comparison of dividend yield against dividend growth makes the case that reinvested growth often beats a high payout. The cost is that the shareholder cannot count on any income while waiting.
The price is also a poor guide to sentiment on days when news arrives. After nine of the last twelve earnings reports, the stock fell the next day, and the average one-day move was -1.4%. The latest, on August 10, was a gain of 1.5%. A stock that drifts lower after most reports usually is not being punished for the quarter, because the quarter’s headline profit depends on markets. I read it as investors selling the strong number on the assumption that it will not repeat.
Where I could be wrong
StockVane’s own quantitative grade for the stock moved from C (score 56) on September 8 to D (score 32) on September 20. I would not lean on that in either direction. It is a model output, and a model that scores earnings quality will look at an erratic profit line and mark it down. The grade agrees with my caution, but it is built on the same numbers, so it is not independent evidence.
Two things could make this analysis too cautious. First, a large decline in equity markets would push reported profit down sharply, and if the shares fell more than the profit did, the 12.8 multiple would start looking like a real bargain. Second, coverage of just two analysts means consensus can be stale. A third or fourth analyst starting coverage could pull the average target up or down by more than any earnings report.
Our July piece on Microsoft, another trillion-dollar company, was written about a stock with 32 analysts and an argument that never stops. Berkshire has the opposite problem: a very large company with almost no one interpreting it in public.
The cash line I would follow
At $509.77 against a $510 fair value there is no margin of safety in the price, so I would not add here on the valuation. I would wait for one of two things: a price near the 52-week low of $464, which would put the stock about 9% under Morningstar’s figure, or a quarter in which cash rises back above $58 billion while premiums earned hold near $22 billion. Either one would give me something concrete to act on.
Gavin Thorne has invested in U.S. stocks for six years and previously worked at a large publicly traded internet company. He writes about income-oriented strategies, including cash-secured puts, and about how he reads company data. This article reflects his personal research process and is for informational purposes only. It does not constitute investment advice.
Sources: Dividends (SEC Investor.gov glossary) (https://www.investor.gov/introduction-investing/investing-basics/glossary/dividend) · Dividends tax topic (IRS) (https://www.irs.gov/taxtopics/tc404)