
On July 29, Lam Research reported a fiscal fourth quarter of $6.72 billion in revenue, up 30% from a year earlier, and the stock rose 18.0% that day. On the September 18 close it sat $288.11, still 34% below its 52-week high of $438.50. A record quarter, a double-digit pop and a one-third drawdown from the peak can all be true of the same stock. The question this note tries to answer is what that combination says about how the market is pricing the machines that make the chips.
Lam does not make chips. It sells the etch and deposition tools that chipmakers use to build them, and it gets paid when its customers spend on new capacity. That makes the revenue line a proxy for the industry’s capital budgets, and the stock a bet on how long those budgets keep rising. My read is that the business is in its best shape in six years and that the price already reflects it: at $288.11 the shares trade at 50.0 times trailing earnings, and the case for owning them from here needs earnings to nearly double.
A business that shrank 14% and then grew 56% in two years
Lam’s fiscal year ends in June. Revenue was $17.43 billion in fiscal 2023, fell 14% to $14.91 billion in 2024, then grew 24% and 26% to reach $23.23 billion in fiscal 2026. The financials tab shows the same swing in profit, with diluted EPS going from $3.32 to $2.90 and then to $5.76.
| Fiscal year | Revenue | Revenue growth | Gross margin | Operating margin | Diluted EPS |
|---|---|---|---|---|---|
| FY2022 | $17.2B | +18% | 45.7% | 31.2% | $3.27 |
| FY2023 | $17.4B | +1% | 44.6% | 29.9% | $3.32 |
| FY2024 | $14.9B | -14% | 47.3% | 28.7% | $2.90 |
| FY2025 | $18.4B | +24% | 48.7% | 32.0% | $4.15 |
| FY2026 | $23.2B | +26% | 50.5% | 35.3% | $5.76 |
Two things stand out. First, this is a cyclical business and the last downturn was real. Second, the recovery has come with better economics. Gross margin rose from 44.6% in fiscal 2023 to 50.5% in fiscal 2026, and operating margin from 29.9% to 35.3%. More revenue at a higher margin is why net income reached $7.27 billion, against $3.83 billion two years before.
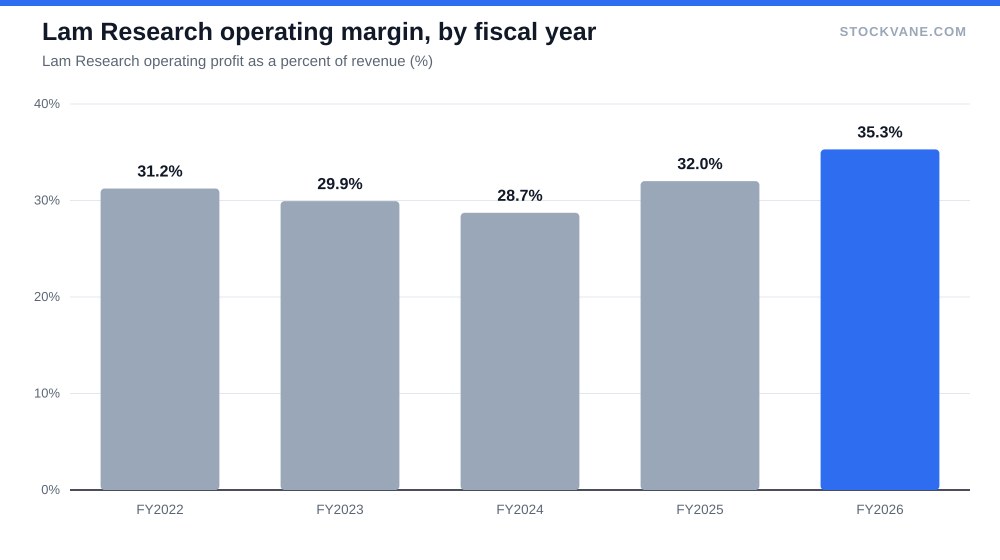
Earnings per share grew 39% in fiscal 2026 while net income grew 36%. The small gap suggests the share count is shrinking, so buybacks are adding to per-share growth, though I would confirm that in the filing before leaning on it.
History adds a caution. Fiscal 2021 revenue rose 46%, and the next three years brought growth of 18%, 1% and -14%. A year of very fast growth was followed by two flat-to-modest years and one decline. Fiscal 2026’s 26% is a slower version of the same kind of surge. The past need not repeat. It is still the base rate for a company whose customers order in waves.
The last quarter and the next one
The four most recent quarters of revenue grew 28%, 22%, 24% and 30% year over year. The latest, at $6.72 billion, was 15% above the quarter before it. Multiply it by four and the run rate is about $26.9 billion, roughly 16% above the fiscal 2026 total. At the current market value of $361 billion, that puts the stock at about 13.4 times run-rate sales.
Reaction to reports has been lopsided. The last four report days moved the stock +18.0%, -2.6%, +3.6% and +4.5%. The average absolute move is 7.2%, and one of the four accounts for most of that. That July jump is the number I would be careful with. A stock that can add 18% in a day can also give some of it back on a single guidance line.
Where the customers are
Fiscal 2026 revenue by customer location shows how concentrated the exposure is. China accounted for 33.8% of sales, about $7.86 billion. Taiwan added 22.5%, Korea 19.4%, Japan 9.3% and the United States 6.6%. Those five add up to about 92% of revenue.
One-third of sales from a single country is a risk that a valuation multiple has to absorb. Taiwan and Korea together are 41.9%, and those are the home markets of the large foundry and memory makers whose spending drives the cycle. The United States, is only 6.6%. If that mix shifts, Lam is in the middle of it. I do not have the export rules in our data and will not guess at how they apply. What I can say is that if China’s share fell from 34% without other regions making up the difference, revenue would feel it directly.
What the multiple is asking for
The valuation tab shows a trailing P/E of 51.8 in our history series, against a five-year average of 27.0 and a five-year band of 13.6 to 40.3. That places today’s ratio at the 93rd percentile of its own range. (The quote snapshot shows 50.0; the difference is a date-stamp effect between two data series.) The forward P/E is 31.7, which implies analysts expect about $9.10 a share over the next year, up 58% from $5.76.
Here is what the market is paying for. If the P/E returned to its five-year average of 27.0, the trailing EPS of $5.76 would support about $155. Even on the forward estimate, 27 times $9.10 is about $245, or 15% below the current price. To justify $288 at 27 times, earnings would have to reach $10.69, 86% more than the last twelve months delivered. That is not impossible in a boom. It is a lot to ask of a business that lost 14% of its revenue just two fiscal years ago.
| Company | Trailing P/E | Distance below 52-week high | Market cap |
|---|---|---|---|
| Lam Research | 50.0 | 34% | $361B |
| Applied Materials | 38.4 | 40% | $353B |
| KLA | 48.4 | 42% | $231B |
| ASML | 53.2 | 16% | $645B |
There is a further wrinkle in how to read a P/E for a company like this. Equipment makers look cheapest at the top of a cycle, when earnings are highest, and most expensive at the bottom, when earnings have collapsed. Fiscal 2024’s EPS of $2.90 would have put the same price at 99 times earnings. So a ratio near 50 today is not a sign that the market expects a cycle to end. It is a sign the market expects this one to run longer than the last.
The peers offer some context, and it cuts both ways. Applied Materials trades at 38.4 times earnings, KLA at 48.4 and ASML at 53.2, so Lam is not out of line with the group. But the group is priced for the same thing, and all three American names are far below their highs: 40% for Applied, 42% for KLA and 34% for Lam. For a longer look at the European member of that group, see our note on ASML, the best business in semiconductors and the hardest to time.
Who is on each side
Of 24 analysts covering the stock, 88% rate it a buy and none a sell. The average target of $395 sits 37% above the price, but the range is wide: the lowest is $275, 4.6% below the price, and the highest is $700, 143% above it. When the range runs from a small loss to nearly two and a half times the price, the analysts are telling us they do not agree on the cycle, even if they agree on the rating.
Short interest is modest, 2.2% of float as of August 31, with 3.8 days to cover. The StockVane quant rating went from a C with a score of 57 on September 8 to a B with a score of 94 in the latest reading, which is a large swing in under two weeks. Our newsfeed also carries a September 4 headline reporting a $17.41 million share sale by a company officer. Insider sales are routine, and I would read no intent into one. It still sits on the same page as the record quarter.
The stock is 131% above its 52-week low of $124.58, so anyone who bought the low is sitting on more than double. The dividend yield is 0.36%, which is not a reason to own it.
What I am leaving out, and what would make me wrong
Our data does not include Lam’s order backlog, its split between etch and deposition, or its service revenue, and those would help separate lasting demand from a one-time pull-forward. The broader debate is framed in the AI capex bubble question, because Lam’s customers are the ones doing the spending. If their budgets stall, this business gets the news first. The semiconductor stocks worth owning beyond Nvidia covers who else is exposed.
The counter-case to my caution is simple. Margins have improved for three years, revenue is growing at a rate of 30%, and the forward P/E of 31.7 is well below the trailing ratio. If earnings reach $9.10 and the market accepts a multiple in the mid 30s, the stock has room. I would need to be wrong about the multiple and right about the numbers, which is a plausible combination.
The quarter I would read first
The next report should land in late October, judging by last year’s October 22 date. Three lines matter. Revenue needs to hold above the $6.72 billion just reported, since a sequential decline would be the first crack in four straight quarters of 20%-plus growth. Gross margin needs to stay at or above 50.5%. And China’s share of sales, when the annual figures update, needs to stay near 34% or come down without the total falling. If revenue slips below $6.72 billion while the stock still trades near 50 times trailing earnings, I would take that as the market paying a peak multiple on peak sales.
Financial disclaimer: The content on StockVane is for educational and informational purposes only and should not be construed as professional financial advice. Stock market investing involves risk of loss.
Sources: Dividends (SEC Investor.gov glossary) (https://www.investor.gov/introduction-investing/investing-basics/glossary/dividend) · Dividends tax topic (IRS) (https://www.irs.gov/taxtopics/tc404)