
Sandisk’s latest quarter brought in $8.96 billion. Three months earlier the same company reported $5.95 billion, a 51% jump before any year-on-year comparison gets applied. Against the quarter a year before, the gap is 4.7 times, which is where the +372% headline comes from.
Micron sits one line below at +346%, and its own sequential gain was 74%. Two memory makers, both accelerating from quarter to quarter, at the top of a list of 286 stocks. That pairing is the subject of this piece, along with what the rest of the top twelve says about how much of the ranking is one story and how much is several.
Our method is simple. We took every stock in StockVane’s coverage that reports more than $1 billion of quarterly revenue, pulled the most recent reported quarter, and ranked by growth against the same quarter a year earlier. We dropped a few stale filings and the duplicate share class of Petrobras, which left 286 companies. The median grew 13.3%. 104 grew more than 20%, 29 more than 50%, 6 more than 100%, and 8 shrank. My read: growth at this speed is rare, and the top of the list is more concentrated than the count of sectors suggests.
The twelve fastest
The table lists them with revenue, growth, the change from the previous quarter, and market value. The quarters do not line up: Micron’s is the one that ended May 27, while Nvidia’s ended July 25, so the table shows each company’s own fiscal label.
| Stock | Fiscal quarter | Revenue | vs a year earlier | vs prior quarter | Market cap |
|---|---|---|---|---|---|
| SanDisk (SNDK) | Q4 FY26 | $8.96B | +372% | +51% | $262B |
| Micron (MU) | Q3 FY26 | $41.46B | +346% | +74% | $1.1T |
| Bloom Energy (BE) | Q2 FY26 | $1.07B | +166% | +42% | $78B |
| Lumentum (LITE) | Q4 FY26 | $1.01B | +109% | +24% | $84B |
| NVIDIA (NVDA) | Q2 FY27 | $96.22B | +106% | +18% | $5.4T |
| Teradyne (TER) | Q2 FY26 | $1.33B | +104% | +4% | $58B |
| Enbridge (ENB) | Q2 FY26 | $29.32B | +97% | +31% | $106B |
| Palantir (PLTR) | Q2 FY26 | $1.94B | +93% | +19% | $427B |
| Broadcom (AVGO) | Q3 FY26 | $29.59B | +86% | +33% | $1.7T |
| Energy Transfer (ET) | Q2 FY26 | $34.33B | +78% | +24% | $73B |
| Canadian Natural (CNQ) | Q2 FY26 | $17.21B | +78% | +39% | $102B |
| Apollo (APO) | Q2 FY26 | $11.15B | +64% | +121% | $74B |
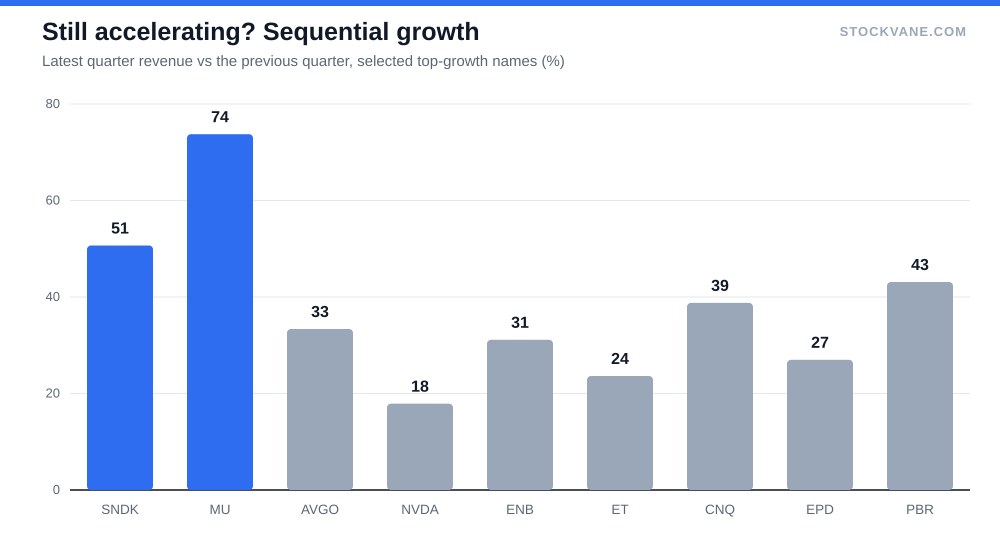
Read the last two numeric columns together. Year-on-year growth tells you how far a company has traveled; the sequential column tells you whether it is still moving. Nvidia’s +106% carries only an 18% step from the prior quarter, on a $96.22 billion base. Broadcom’s +86% comes with a 33% step. Sandisk and Micron are different: their sequential moves of 51% and 74% are larger than what most companies on this list achieve in a full year.
Memory: two names, one supply cycle
When two companies in the same industry both report growth above 300%, a company-specific cause becomes the weaker explanation. Combined, Sandisk and Micron booked $50.4 billion in their latest quarters, which is 18% of all revenue in the top twelve. Micron alone produced $41.46 billion in a single quarter, and yet its trailing price-to-earnings ratio is only 23.0.
Trailing earnings, though, lag badly. Micron’s valuation page shows a forward P/E of 6.8 against the trailing 23.0, a gap that says the market is pricing the quarters still to be reported. The stock sits 19% below its 52-week high after a rise of more than 500% from the low.
Micron’s segment table adds a detail. In its latest quarter the cloud memory unit produced $13.77 billion, or 33.2% of revenue, and the core data center unit $11.52 billion, or 27.8%. Together that is 61% of sales from data-center customers. The mobile and client unit, at $11.52 billion, and automotive and embedded, at $4.63 billion, are the more ordinary consumer and industrial end markets. The growth is broad, but its center of gravity is the same AI build-out that lifts Nvidia.
So why not simply buy the top of the list? Because of what this industry did last time. Micron’s revenue fell from $30.8 billion in fiscal 2022 to $15.5 billion in fiscal 2023, a drop of almost half, and its gross margin went to -9.1% before recovering to 39.8% in fiscal 2025. Growth this fast in a commodity-like product is usually a price story and a supply story before it is a demand story. That does not make it wrong. It makes the sequential column the number to track, because a memory upcycle ends when the quarter-over-quarter line stops rising, well before the year-over-year line falls.
AI hardware: the same demand, spread wider
Take the memory pair out and much of what remains looks like data-center spending. Nvidia, Broadcom, Lumentum, Teradyne, and Bloom Energy all sit in the top twelve, and Palantir arrives from the software side. Different business models, one shared source of demand.
The smaller names in this group carry the opposite risk. Bloom Energy, Lumentum and Teradyne each earn about $1 billion a quarter, so a few large orders move the percentage. Bloom’s revenue went $0.40 billion, $0.52 billion, $0.78 billion, $0.75 billion, then $1.07 billion. That is a business growing fast, but not in a straight line: one quarter in the sequence was lower than the one before it. On a base this small, a single delivery schedule can swing the year-on-year figure by 30 or 40 points.
Palantir is the cleanest example of a company where the growth rate is not the debate. Its +93% on $1.94 billion is real; the question in our Palantir valuation math is what multiple that growth can carry. For the semiconductor names, the framing is similar to how we described ASML’s position in the chip supply chain: excellent businesses whose timing is hard.
Three of the twelve, Micron, Nvidia, and Broadcom, are worth $8.2T combined, and Nvidia alone is a $5.4 trillion company growing 106%. Growth screens usually surface small bases. This one does not, and that is what makes the list unusual.
Energy: six names that look like a price move
Look further down the top twenty and a different cluster appears. Enbridge (+97%), Energy Transfer (+78%), Canadian Natural (+78%), Enterprise Products (+61%), and Petrobras (+60%) all reported quarters ending in late June, and EOG Resources (+59%) is just behind. Their sequential jumps were 31%, 24%, 39%, 27%, and 43%, respectively.
Six energy and pipeline companies growing revenue by that much in a single quarter is difficult to explain with volume. I read it as a commodity price move flowing through revenue lines, and possibly acquisitions or accounting changes for some of them. The database does not tell us which, and we have no news item that attributes it, so treat this as inference. What matters for a reader is the consequence: this growth is not the same kind as Sandisk’s. Revenue for these companies moves with prices, and the same mechanism reverses.
Not all growth is organic
Apollo Global Management shows why a ranking like this needs footnotes. Its quarterly revenue was $6.81 billion, $9.82 billion, $9.86 billion, then $5.06 billion, before rebounding to $11.15 billion. A +64% reading on that line is largely a comparison between a normal quarter and an unusually strong one, and the previous quarter’s dip shows how much the number moves. Asset managers report investment gains and performance fees inside revenue, so their year-over-year comparisons are noisy by design.
Acquisitions have the same effect. A company that buys a competitor doubles its revenue without selling one more unit. We did not adjust for deals, which is a real limit: the ranking measures reported revenue, and only revenue. It says nothing about margins, valuation, cash flow, or share count, and we did not test whether the growth was profitable. We also left out any company with a quarterly base under $1 billion, where a single contract can produce triple-digit growth without meaning anything.
Percent versus dollars
Sort the twelve in the table by the dollars added instead of the percentage and the order changes. Nvidia added $49.5 billion of quarterly revenue in a year, Micron $32.2 billion, Energy Transfer $15.1 billion, Enbridge $14.4 billion and Broadcom $13.6 billion. Sandisk, first by percentage, added $7.1 billion.
That is why the top twelve, with $274 billion of quarterly revenue between them, account for 1% of the $30,140 billion booked by all 286 stocks in the ranking. A screen built on percentages picks out the fast movers. A screen built on dollars picks out the ones that move the index. Both point to Nvidia and Micron.
What the distribution says
Only 8 of 286 shrank. The middle of the list is uneventful, with a median of 13.3%. The extremes are where the story is, and the extremes are narrow: 6 companies above 100%, which is 2.1% of the list.
A revenue-growth screen rewards the businesses at the peak of a cycle and penalizes the steady compounders. For a longer look at how income and growth strategies compare, our piece on high dividend yield versus dividend growth makes the case from the other direction.
Two prints that would tell us more
Micron reports fiscal fourth-quarter results on September 30 (per the DB earnings calendar). If revenue comes in below the $41.46 billion of the previous report, the sequential column turns negative for the first time in this run, and the +346% becomes a high-water mark. If it exceeds $50 billion, the memory story is still accelerating, and the forward P/E of 6.8 looks like a bargain that is already being taken.
The second is Sandisk’s next quarter. Its year-ago base will be $2.31 billion, so even a sequential decline to $6.93 billion would still print +200%. The headline growth rate is safe for a while. The sequential line is not, and it is the one that would show the cycle turning first.
Financial disclaimer: The content on StockVane is for educational and informational purposes only and should not be construed as professional financial advice. Stock market investing involves risk of loss.
Sources: Dividends (SEC Investor.gov glossary) (https://www.investor.gov/introduction-investing/investing-basics/glossary/dividend) · Dividends tax topic (IRS) (https://www.irs.gov/taxtopics/tc404)