
Two things happened to Datadog within 24 hours in mid-September: Bernstein downgraded the stock to Hold on the 16th, and a company officer sold $14.56 million of common stock on the 17th, per the news feed in our data. Neither tells us much alone. Together they show what the market is arguing about at $230 a share, 21.5% below the 52-week high of $293.
The title on this page says the land-and-expand model is slowing down. We checked that against the reported numbers, and revenue does not support it. Datadog’s growth has not slowed; it sped up. What has slowed is how much of that revenue turns into profit, and the stock, at 459.8 times trailing earnings, is priced as if that leak is temporary. The rest of this piece lays out the evidence and names the number that would prove the leak permanent.
Revenue: the premise fails
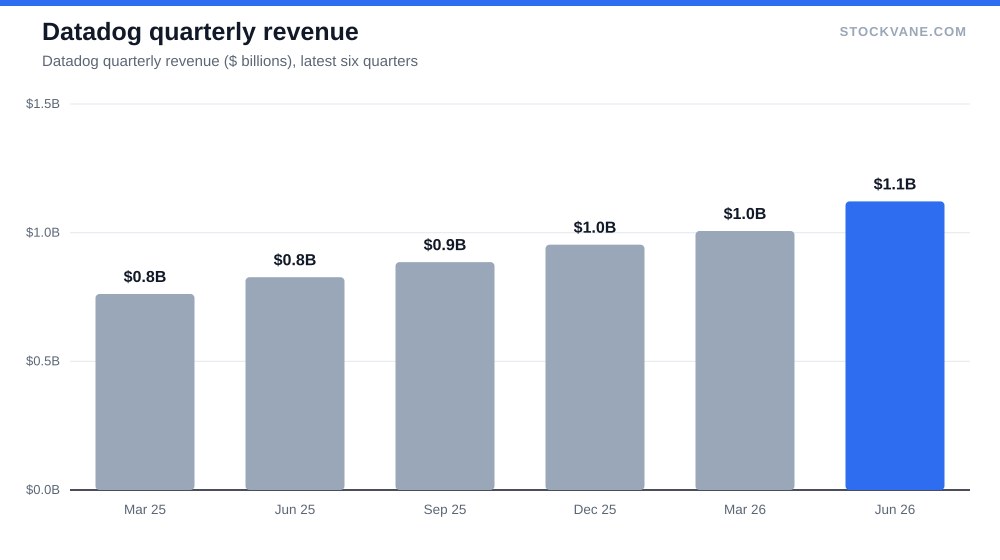
Land-and-expand means a customer buys one product, then adds more as its infrastructure grows. If it were fading you would see growth decelerating and then falling below its own history. The reported financials show the reverse. Annual revenue growth ran 63% in 2022, 27% in 2023, 26% in 2024 and 28% in 2025, when revenue reached $3.4 billion from $2.7 billion.
The quarterly series is more telling. Four quarters in a row read 28%, 29%, 32% and, in the June 2026 quarter, 36%, on $1.1 billion of revenue. Growth of 36% on a base that size is not a mature business coasting. At that pace the current quarter alone annualizes to $4.5 billion, about 31% above the last fiscal year’s total.
One caveat on interpretation. The database gives us total revenue and a single reported segment, an observability and security platform, so we cannot split growth between new customers and existing ones. Net revenue retention, the standard measure of expansion within customers, is not in our data. All we can say is that whatever the mix, the total accelerated. Anyone who wants to argue the model is slowing needs a number for that, and we do not have one.
Profit: this is where the pressure shows
Here the title has a point, just aimed at the wrong line. Net income fell to $0.1 billion in 2025 from $0.2 billion the year before, a 41% drop, and diluted EPS went from $0.52 to $0.31. Operating income turned negative, from roughly $0.05 billion of profit in 2024 to a loss of about $0.04 billion. The database’s EBIT margin tells the same story: 4.0% against 7.9% a year earlier. The operating margin (operating income over revenue) is -1% for the latest year. The two measures differ in definition, and both point the same way.
Gross margin barely moved: 80.0% against 80.8%, a fall of less than a point. So the cost of delivering the product is not what changed. The squeeze is lower in the income statement, in the spending that sells and builds it. Our database does not itemize that spending, so we do not know whether it is sales hiring, research, or something else. What we know is the result: revenue up 28%, and profit down 41%.
That is a real deterioration, and it is worth setting against the earlier years. In 2022 the company lost about $0.05 billion; profit swung positive in 2023 and 2024 and then retreated. Reading the six-year series, profitability is a young feature of this business, not an established one.
The multiple assumes the leak stops
On the valuation page, trailing EPS is $0.50 and the stock costs 459.8 times that. The five-year average P/E is 291.7, so the current multiple is 1.6 times its own history, sitting in the 82nd percentile of its range. Against the industry average of 25.9 it is not a comparison worth making: a multiple this high is a statement that today’s earnings are nearly irrelevant.
Sales are the fairer lens. Price-to-sales is 20.8 versus a five-year average of 22.3 (72nd percentile, industry average 5.0). On expected earnings the forward P/E is 370.1, using $0.62 of EPS, which is roughly 24% above trailing. So analysts are pricing a recovery in earnings of about a quarter, not a collapse, and the stock still needs that recovery to arrive.
| Metric | Value | Context |
|---|---|---|
| Price (approx.) | $229.92 | 52-week range $98 to $293 |
| P/E (TTM) | 459.8x | Five-year average 291.7x |
| Price-to-sales | 20.8x | Five-year average 22.3x |
| Analyst ratings | 92% buy, 6% hold | 36 analysts; average target $290 |
For a sense of how another expensive software name looks under this kind of test, our valuation math on Palantir works the same problem from the other direction: how much growth is needed before a stretched multiple stops being stretched. Datadog’s growth is real. What is not yet visible is the margin to go with it.
A useful way to feel the size of that bet: the market value is $82.6 billion, against $3.4 billion of trailing revenue. Each dollar of annual sales is valued at about 20.8 dollars, and each dollar of net income at roughly 766. Neither figure is unusual for a software company growing at this rate, which is exactly the point. The stock is not mispriced against its peers. It is priced against the assumption that both growth and margins will hold at once.
There is also a timing problem for anyone who wants to wait for clarity. The stock is 135% above its 52-week low of $98, so much of the recovery has already been paid for by earlier buyers. Someone starting a position now is buying after a large move, with a downgrade from Bernstein fresh in the tape.
Consider what a 36% quarter implies if it merely persisted. Revenue at the $4.5 billion run rate, valued at the current sales multiple of 20.8, is a market value near 93 billion dollars, against the $82.6 billion the stock carries today. So the market is already giving credit for a good part of one more year of expansion, and it is doing so with net income at only 3% of sales. That is the piece a buyer has to accept on faith.
What the sell side and the tape say
Of 36 analysts, 92% rate the stock a buy. The average target is $290, 26% above the price; the highest is $330 and the lowest $158, which sits 31% below the current price. That spread, from $158 to $330, is wide even for a growth stock. It is the analyst version of the argument in this article.
Earnings reactions have been extreme in both directions. The stock moved -19.0% after the August 6 report, following +31.3% in May, +13.7% in February and +23.1% the previous November. The average absolute move is 21.8%. A stock that swings that much on each report is one where the profit line, not the revenue line, is deciding the outcome. Note that the most recent move was negative in the same quarter that revenue growth hit 36%, a mismatch that fits the idea that investors are already pricing for the margin.
Only 2.8% of the float is short, with a days-to-cover of about 2.9, so bears are not crowding the trade. Our quantitative rating is B, up from C two weeks ago. Consider that a small, model-driven vote for the recent revenue strength, and not a forecast.
What would prove the bears right
The counter-case is not hard to state. If the fall in profit is structural, and Datadog has to spend an increasing share of each revenue dollar to keep the growth rate up, then the forward EPS of $0.62 is too high, and a multiple of 370.1 times that is far too rich. At a P/S of 20.8 the stock is priced for growth to stay above 25% while margins recover. Missing either half of that would hurt.
We are not covering the customer-count data, cloud-vendor exposure or stock-based compensation here; none of it is in the data pulled, and each could change the reading of the profit decline. We are also not making a call on the officer sale. One executive transaction, undated relative to any plan, is a fact to record, not a signal to trade. Readers looking at another large-cap platform where the spending line is the argument can compare with Microsoft’s AI bill.
The pair of numbers we would hold it to
Two thresholds, read together. Revenue growth has to stay above 25%, as it has in each of the last three fiscal years and the last four quarters, because a multiple of 20.8 times sales does not survive a single-digit grower. And the EBIT margin has to climb back from 4.0% toward the 7.9% of 2024 within a year. Growth without that margin recovery would confirm the profit decline was not a blip.
If both hold at the next report, the profit dip looks like an investment year and $230 looks like a reasonable price. If growth holds and the margin stays near 4%, the title of this article is wrong about the revenue line but right about the economics.
Financial disclaimer: The content on StockVane is for educational and informational purposes only and should not be construed as professional financial advice. Stock market investing involves risk of loss.
Sources: Price-to-earnings ratio (SEC Investor.gov glossary) (https://www.investor.gov/introduction-investing/investing-basics/glossary/price-earnings-pe-ratio) · Earnings reports (SEC Investor.gov glossary) (https://www.investor.gov/introduction-investing/investing-basics/glossary/earnings-report)