
Snowflake lost $1.29 billion in fiscal 2025 and $1.33 billion in fiscal 2026. The loss grew by about $40 million while revenue rose from $3.6 billion to $4.7 billion, a gain of 29%. Both statements are true, and they are why this stock is hard to argue about in one sentence.
The trailing price-to-earnings ratio is -104.9, which is the arithmetic of a $3.17 loss per share against a $332.43 stock price. It tells you nothing about value. StockVane’s quant rating for Snowflake is a B, with a score of 77 on September 20, and it has stayed a B in every daily reading since September 14. I cannot see inside the model, so I read that steadiness as a sign that it does not punish a company for a negative earnings line. The question for us is whether it is right not to.
I think the answer depends on one trend, and that trend is visible in the financials tab. Losses in dollars are flat. Losses per dollar of revenue are shrinking. Those are different things, and only one of them pays for a $117.3 billion market value.
The margin is moving, the dollar loss is not
Start with the operating picture in the database’s EBIT margin, which measures operating result as a share of revenue. It was -91.9% in fiscal 2021. It improved to -58.6% in fiscal 2022 and -40.8% in fiscal 2023, then barely moved: -39.0% in fiscal 2024 and -35.4% in fiscal 2025. Fiscal 2026 broke the plateau at -27.8%.
That is a 64-point improvement in five years. In cents, Snowflake spent about $1.92 of operating cost for each dollar of revenue in fiscal 2021 and about $1.28 in fiscal 2026. It has not reached a dollar, and the distance still to cover is 28 cents.
| Metric | Value | Context |
|---|---|---|
| Price (approx.) | $332.43 | 52-week range $118 to $385 |
| P/E (TTM) | -104.9x | Five-year average -65.2x |
| Price-to-sales | 21.5x | Five-year average 29.5x |
| Analyst ratings | 91% buy, 9% hold | 35 analysts; average target $435 |
The table explains the flat dollar loss. Revenue growth slowed from 124% in fiscal 2021 to 29% in each of the last two years, while the cost base kept expanding. Net loss went from $0.54 billion to $1.33 billion in dollars, even as it fell from 55% of revenue to 28%. The company is buying growth with real money and the bill has not shrunk in absolute terms.
Gross margin is the part that works. It rose from 59.0% in fiscal 2021 to 68.0% in fiscal 2024, slipped to 66.5% in fiscal 2025 and recovered to 67.2% in fiscal 2026. A 67-cent gross profit per dollar of sales leaves plenty of room for the operating lines to improve if spending grows slower than sales. What it does not tell us is that spending will grow slower.
The quarter that reset the growth question
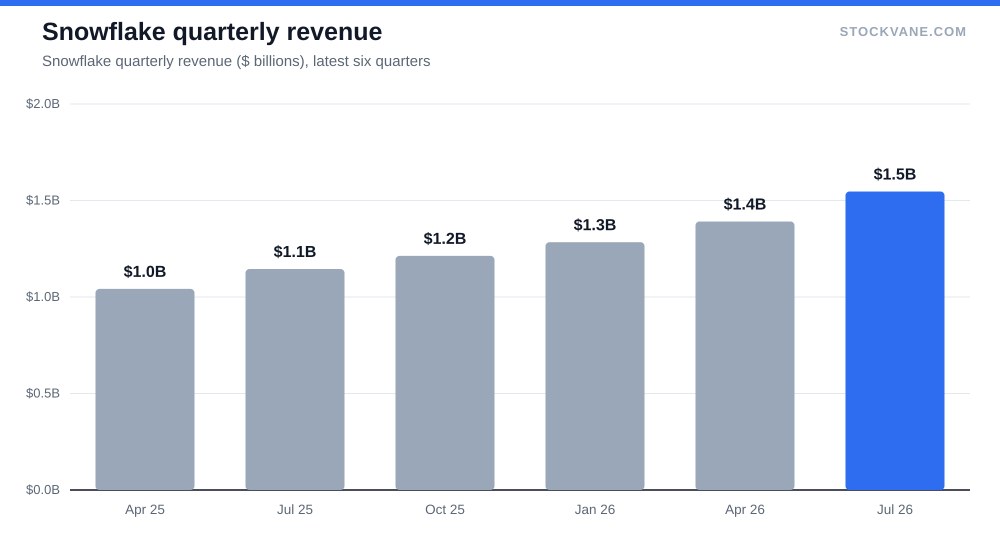
The most recent report, for the fiscal second quarter of 2027, showed revenue of $1.5 billion, up 35% from a year earlier and 11% from the prior quarter. Product revenue was 96.4% of the total, or about $1.49 billion, with professional services at 3.6%. The last four quarters grew 29%, 30%, 33% and 35%.
That acceleration matters more than the margin. A company growing 29% with a margin improving by seven or eight points a year is a slow-burn story. A company growing 35% is one where the revenue base is compounding faster than the cost base, and the margin follows almost mechanically. The current quarter annualizes to $6.2 billion, about 32% above fiscal 2026’s revenue.
The market reacted in proportion. The reaction to the September 2 report was +16.6%, after a +36.5% move in May, a +2.3% move in February and a -11.4% move in December. Four reports, a range of 48 points from worst to best. Holding Snowflake through a report means accepting a swing of that size in either direction, and I would size the position for it. For a different way to take that variance, we wrote about selling puts around big reports.
What the price already asks for
At $332.43 the stock is 13.6% below its 52-week high of $385 and 181% above the low of $118. The valuation tab shows price to sales at 21.5, against a five-year average of 29.5 and an industry average of 5.1. So the stock is cheaper than its own history by about 27% and more than four times the industry multiple.
Price to book is the sharper number. It is 54.3 now against 18.6 on average, which puts it in the 98th percentile of its own five-year range. Book value is a poor yardstick for software, but the direction of that gauge is one more piece of evidence that expectations, not assets, carry this price.
Forward numbers look better on the surface. The database has a forward EPS estimate of $-2.18, against the trailing loss of $3.17, a loss about 31% smaller. On that number the forward P/E is -152.4, still negative. The point at which this multiple becomes a usable number is at least a year out, and the quant grade does not care about that gap.
It is worth comparing how we handled a similar problem elsewhere. In our Palantir valuation math we asked what growth rate the price required. The same question applies here. At 21.5 times sales, and a 35% growth rate that will fade, I would want to see the fiscal 2027 margin near -20% before calling the price fair.
The strongest case against this view is simple. Snowflake has lost money in every one of the six fiscal years in the database, and the annual net loss has never been smaller than $0.54 billion. A skeptic can say that six years of losses is a pattern, and that a 35% growth quarter is the kind of number a company posts just before growth decays toward 20%. That is a fair reading. It would be right if revenue growth fell back under 25% before the margin reached -20%, because then the multiple would have to compress with no profit behind it.
This post does not cover the competitive picture, customer counts or the cash flow statement. None of those are in the numbers we used, and a view on them would be guesswork.
Who is on the other side
Thirty-five analysts cover the stock and 91% rate it Buy. The average target is $435, 31% above the price, with a range from $325 to $525. The lowest target sits about 2% below today’s price. Argus raised its target to $450 on September 5, and Mizuho raised its to $425 on September 4.
Unanimity in analyst notes is not evidence. What it does show is where the expectations are. A stock with 91% Buy ratings needs more good news to rise than one with a split vote, because the marginal buyer has already bought.
Two items point the other way. An officer filed Form 144 notices on September 9 and September 17 to sell Snowflake common stock, at headline sizes of 16.79 million and 4.13 million. Form 144 is a notice of proposed sale, and executives sell for many reasons. I would not read intent into it. And short interest is 5.2% of float, or about 4.9 days of average volume to cover, which is moderate and does not suggest a crowded bet against the stock.
For a broader view of how we track positioning, we lay out our method in how we read money flows.
What the quant grade does and does not tell us
Back to the title. The grade is a B, score 77, and the daily readings have run from 72 to 79 since September 14. A model that was penalizing losses through the P/E would show the score sliding as the multiple gets more negative. It has not. My reading is that the model is weighting other things, such as price trend and revenue momentum, more heavily than trailing earnings.
I cannot verify that from the outside, and seven daily readings are a short sample. A B is also not a buy signal. The stock sits 181% above its 52-week low, so this is a rating that has held up while the price rose, and I would be careful about using it as a forecast.
Where I come out is this. A negative P/E is no reason to avoid Snowflake, and a B grade is no reason to buy it. Owning it rests on growth above 30% on a base of $4.7 billion with gross margin near 67%. Staying wary rests on $117 billion of market value paid for a business that still spends $1.28 to earn a dollar.
The December quarter I would hold it to
Three numbers would change my mind. If quarterly revenue growth falls under 30% while spending stays flat, the margin story is broken. If the fiscal 2027 net loss comes in above the $1.33 billion of fiscal 2026 for a third straight year, the scale benefit is not arriving. And if the EBIT margin does not reach the -25% area when the year closes, the price to sales of 21.5 will look like a peak, not a base.
The next quarterly report is the test. Last year it arrived on December 3. I would want revenue above $1.65 billion, about 36% over the $1.21 billion of the year-earlier quarter, and a narrower loss. Those two facts together would make the negative P/E irrelevant. Anything less and the 13.6% gap to the high starts to look small.
Gavin Thorne has invested in U.S. stocks for six years and previously worked at a large publicly traded internet company. He writes about income-oriented strategies, including cash-secured puts, and about how he reads company data. This article reflects his personal research process and is for informational purposes only. It does not constitute investment advice.
Sources: Price-to-earnings ratio (SEC Investor.gov glossary) (https://www.investor.gov/introduction-investing/investing-basics/glossary/price-earnings-pe-ratio) · Earnings reports (SEC Investor.gov glossary) (https://www.investor.gov/introduction-investing/investing-basics/glossary/earnings-report)